Find all your information.
Right here in ShowTwin.
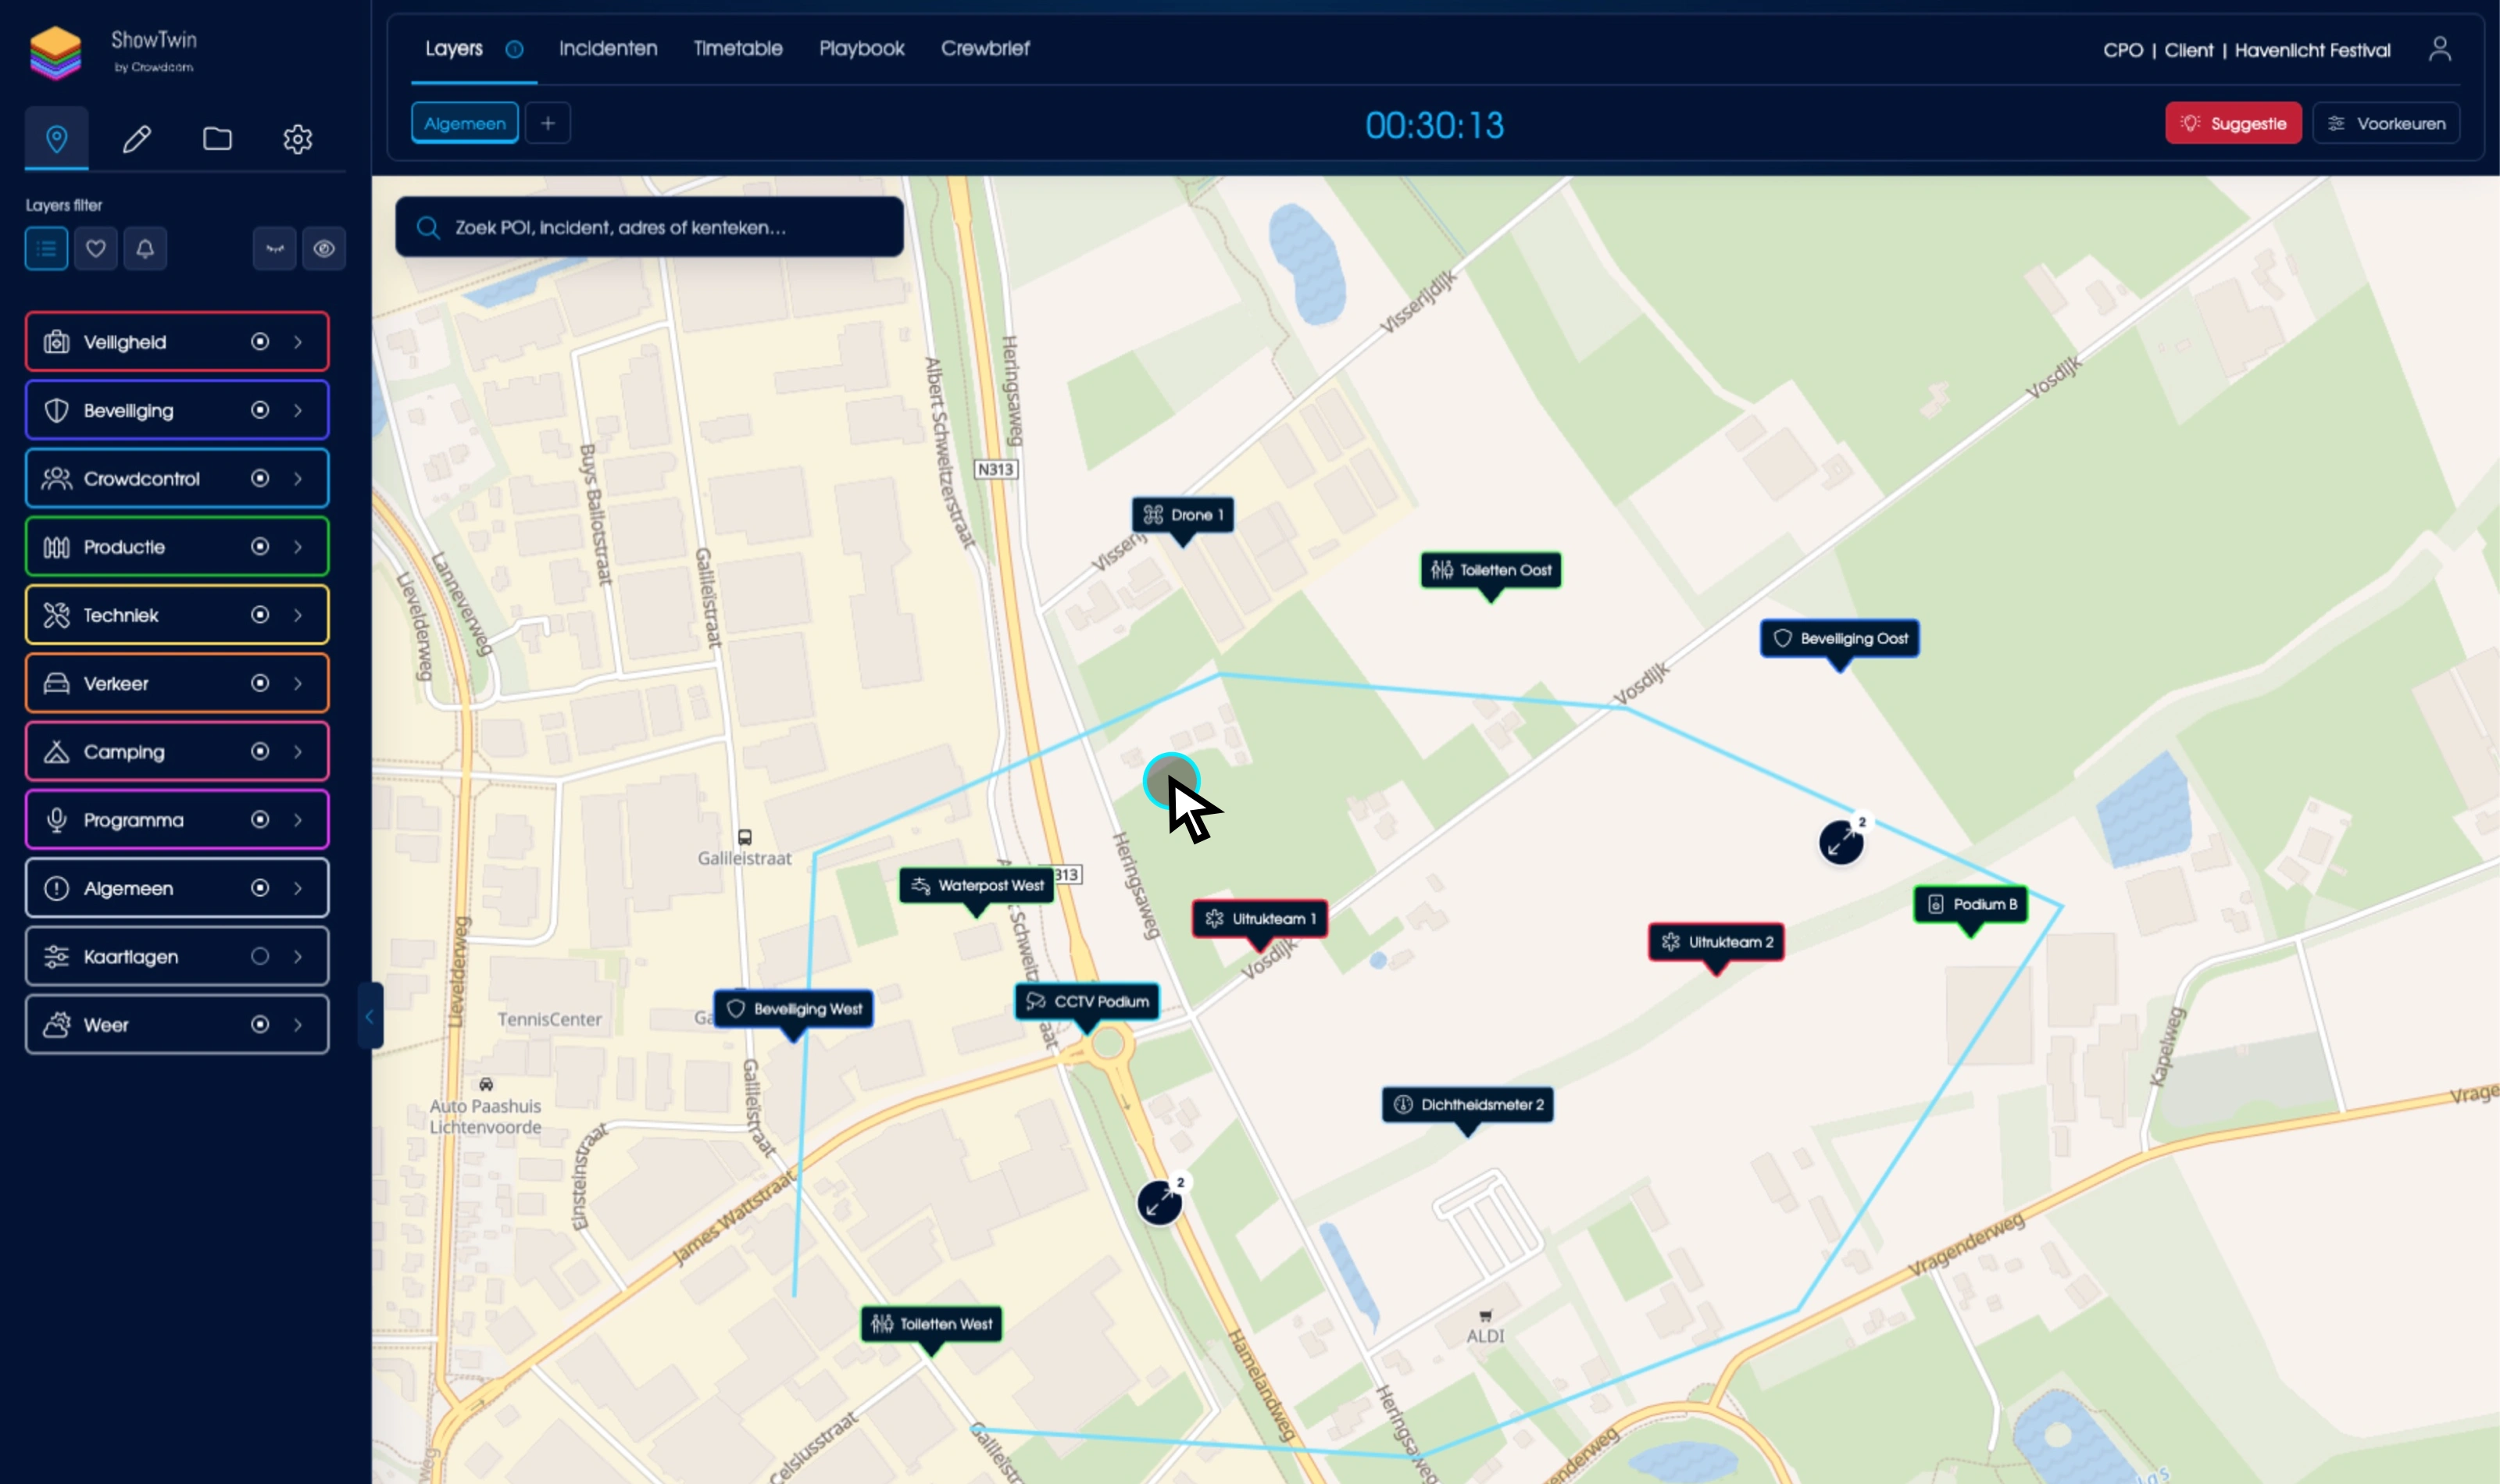
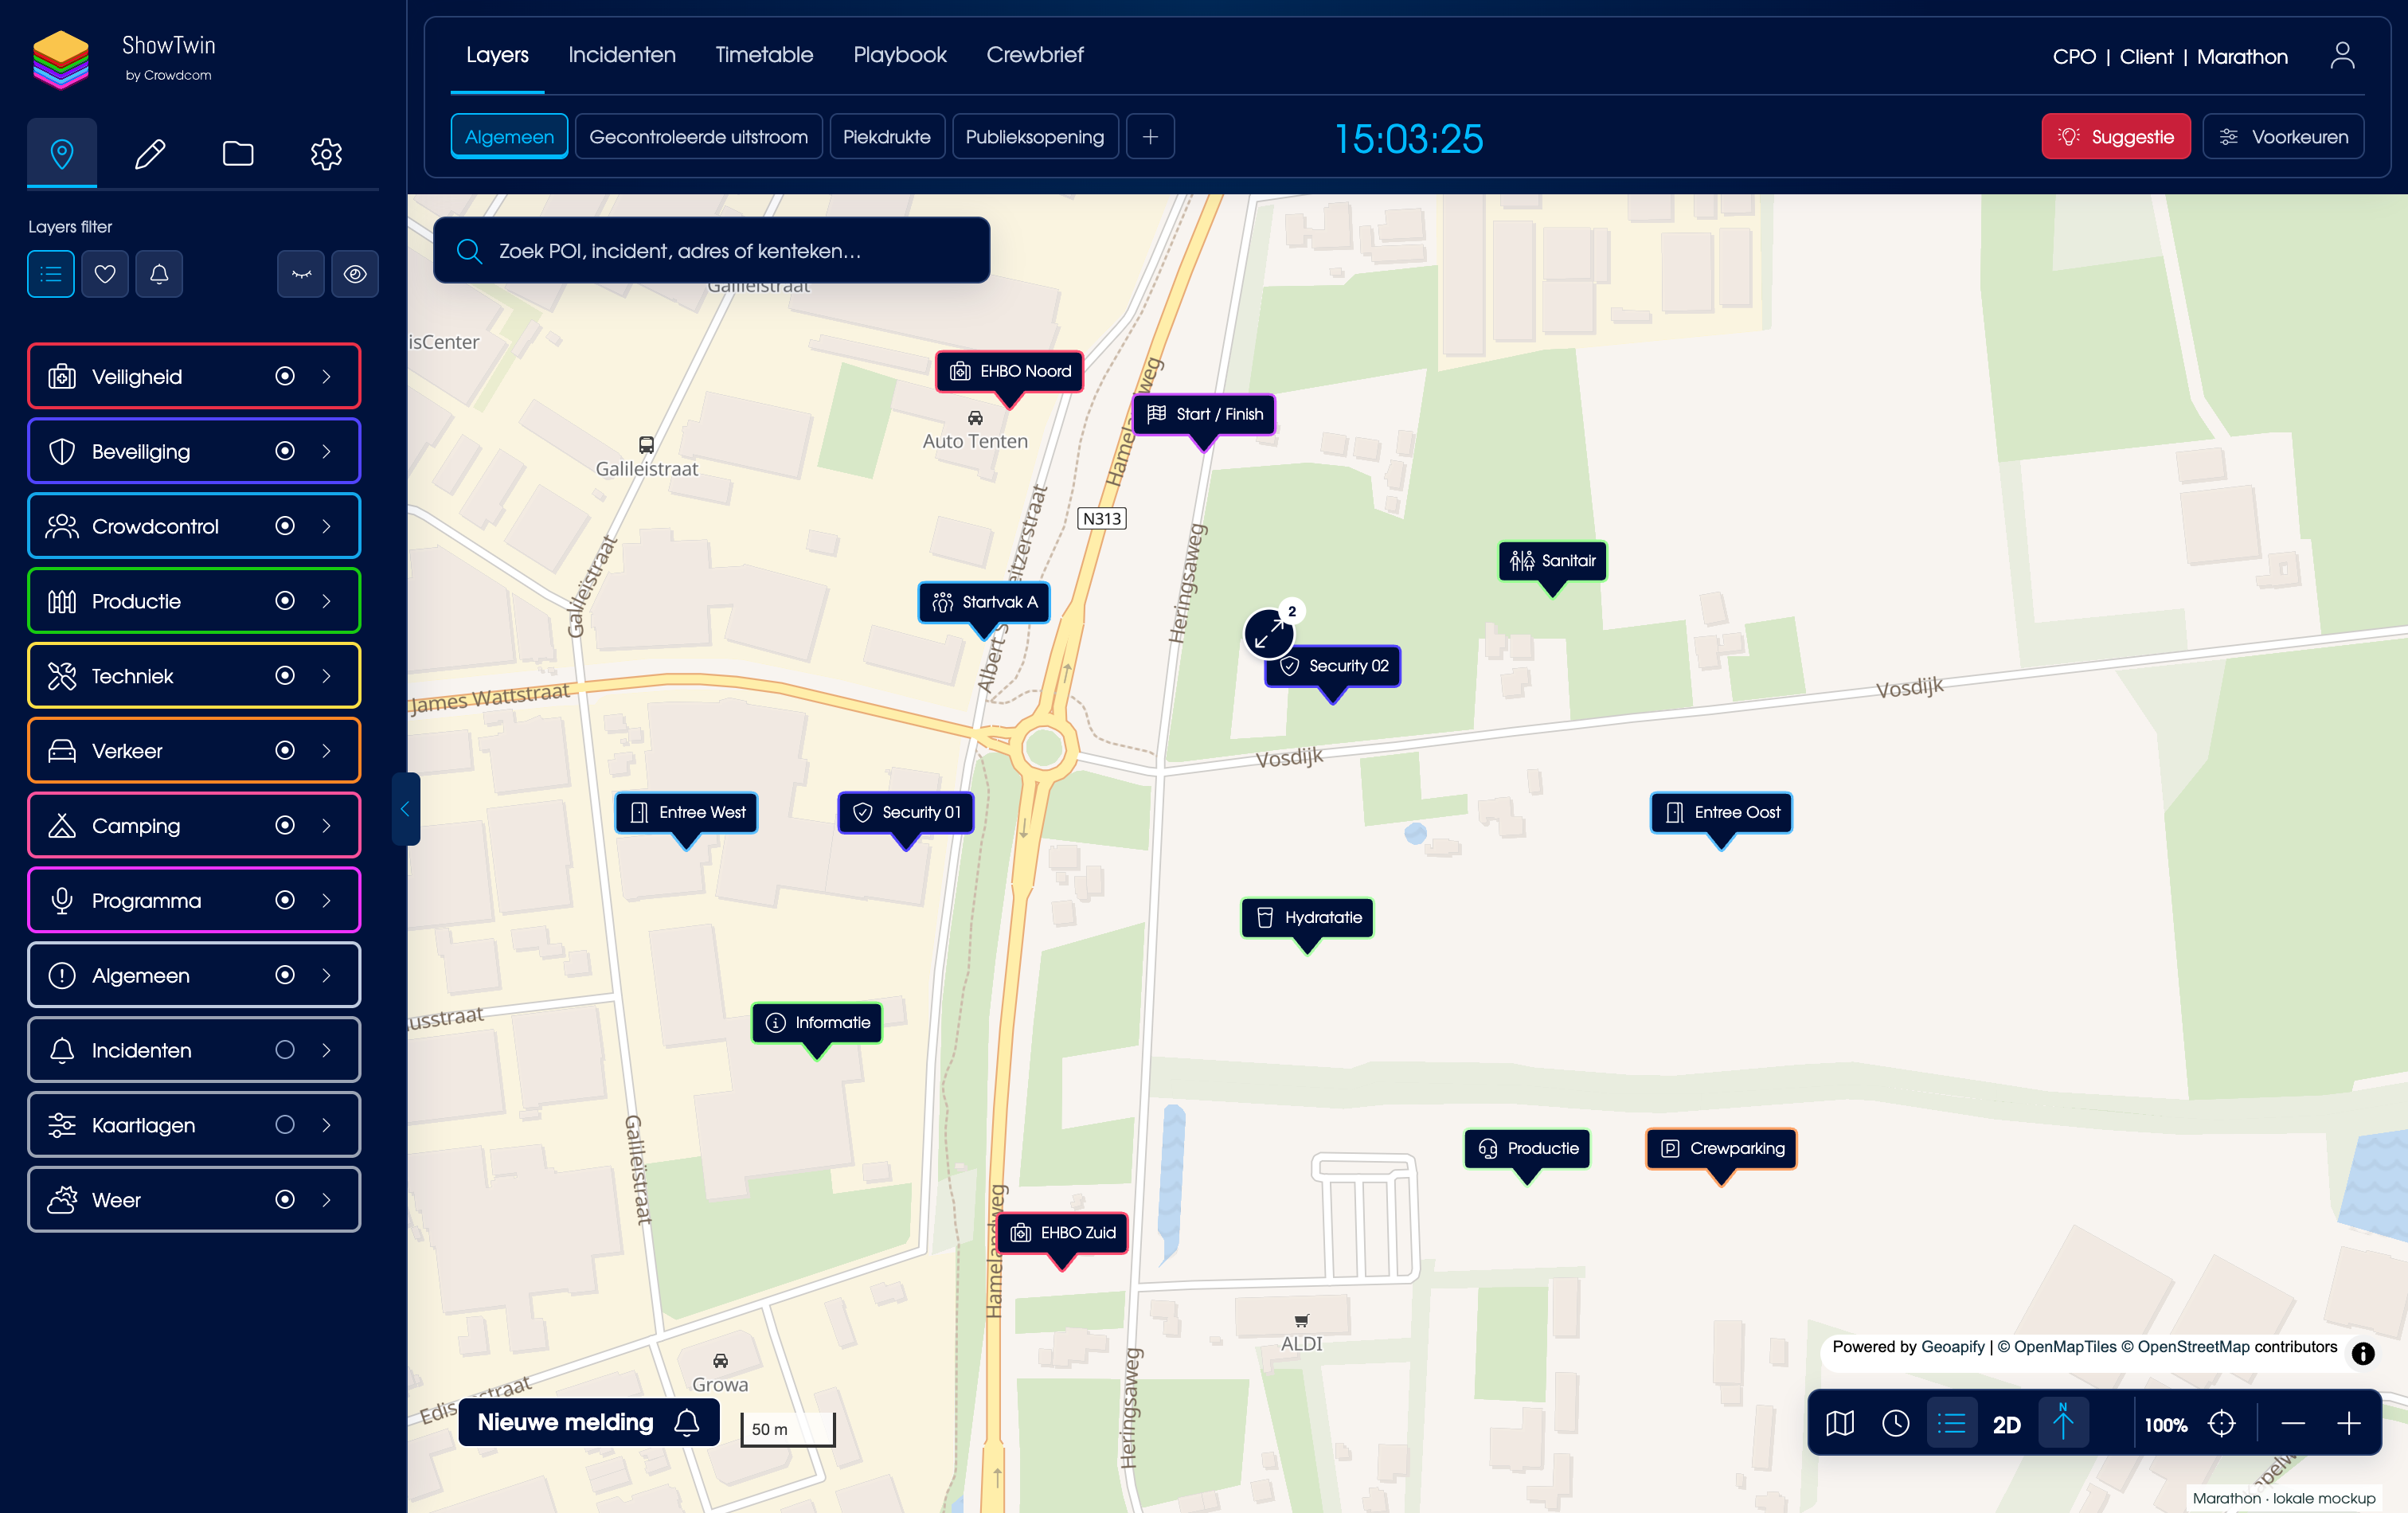
Find everything on one map, from positions and addresses to the weather forecast. Information is clearly organised in tiles.

Searching mapsMaps
Reporting incidentsIncidents
Planning & coordinating teamsTeams
Live drone and camera feedsDrones
ShowTwin brings interactive maps, incidents, data, teams and plans together in one software suite for your Event Control Center. Built for the demands of event safety, from preparation to show day. One shared operational picture.
ShowTwin interface
Find everything on one map, from positions and addresses to the weather forecast. Information is clearly organised in tiles.
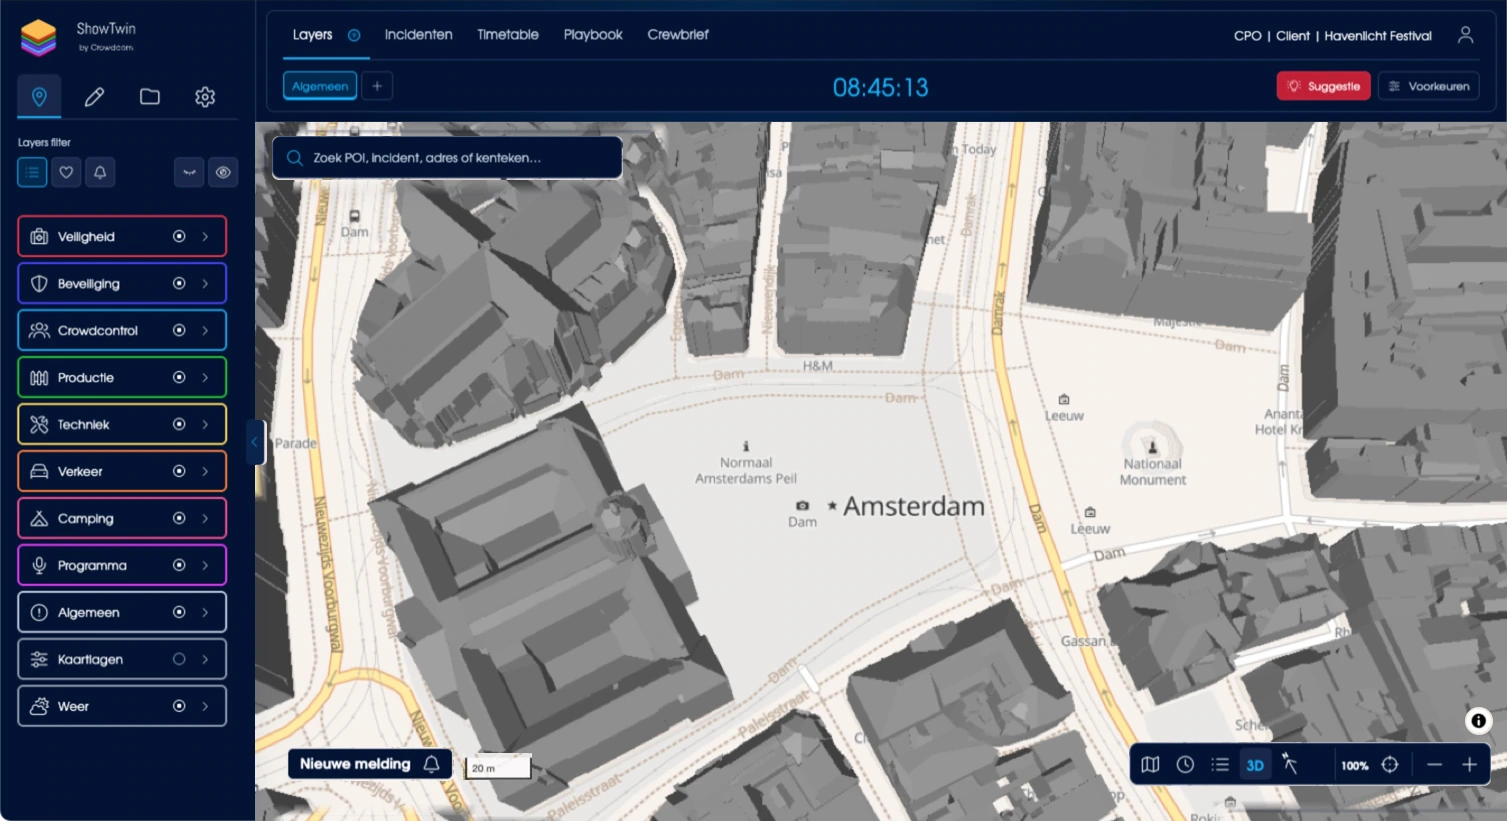
Turn on public transport, road traffic and flight information, and plan around rain and thunderstorms. View woodland and buildings in 3D. All included as standard in ShowTwin. Because context gives you the full story behind a report.
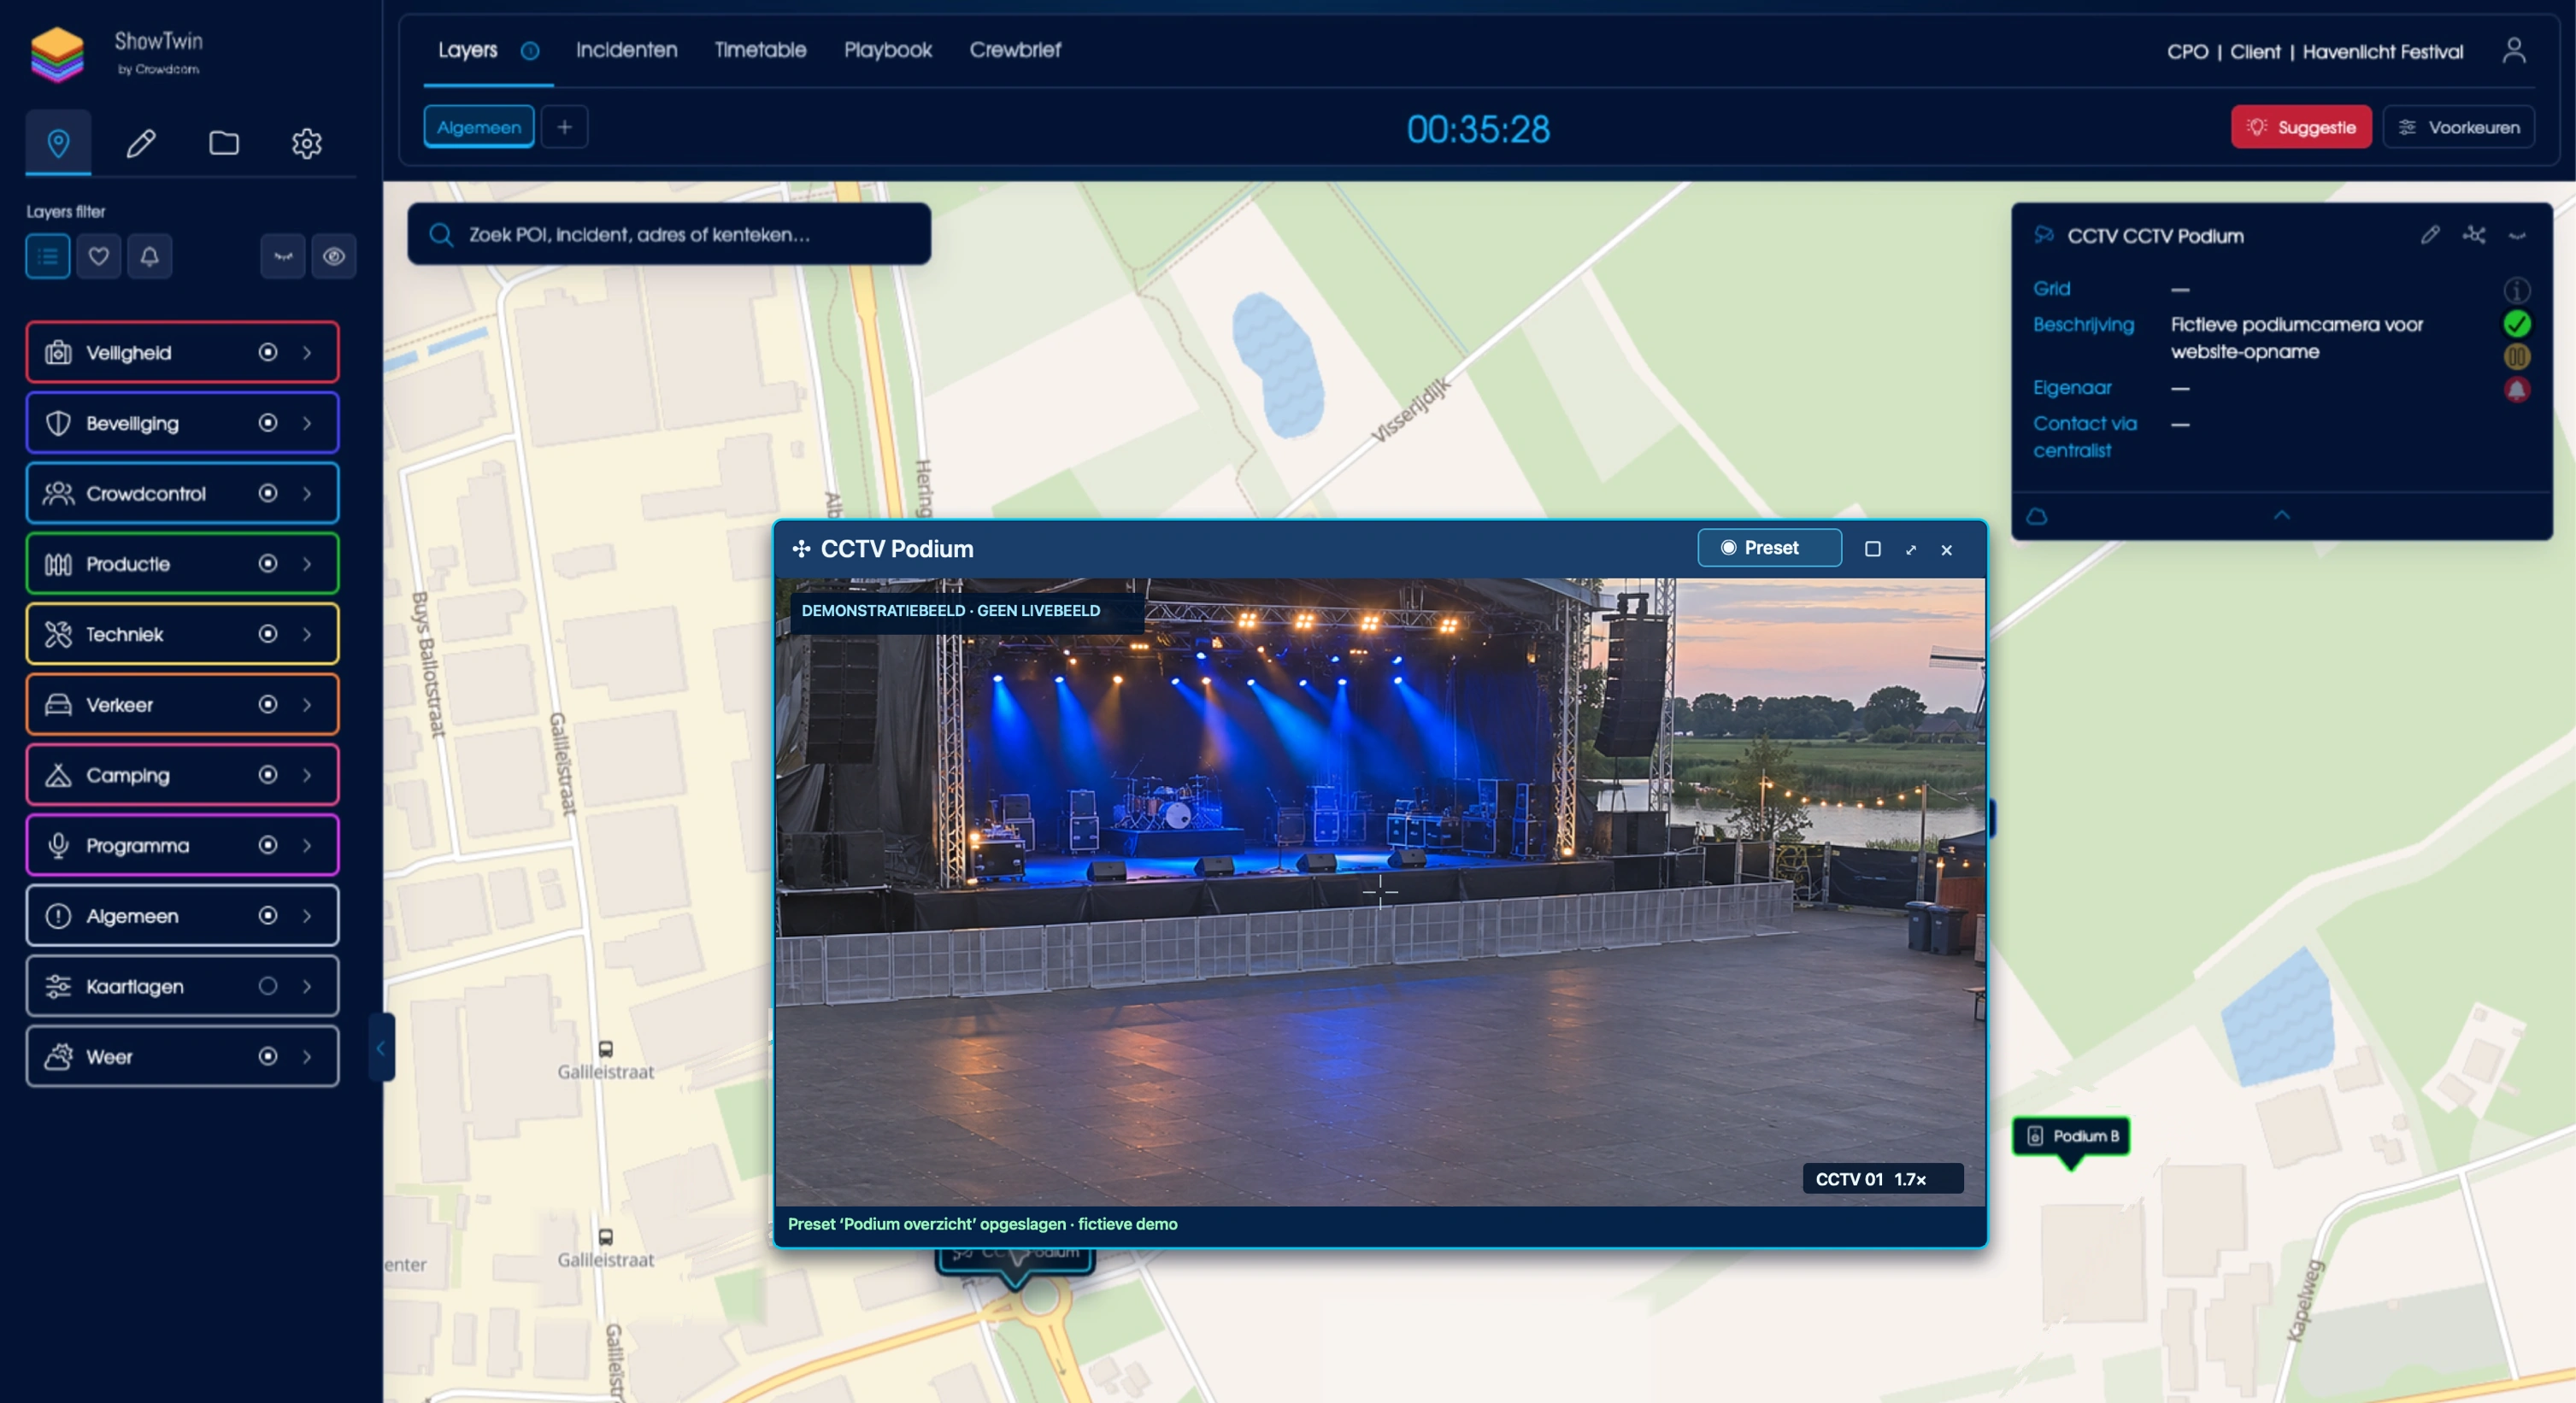
ShowTwin shows drone detections nearby and live feeds from your own drones. Control connected CCTV cameras directly, or have supported cameras automatically point towards an incident.
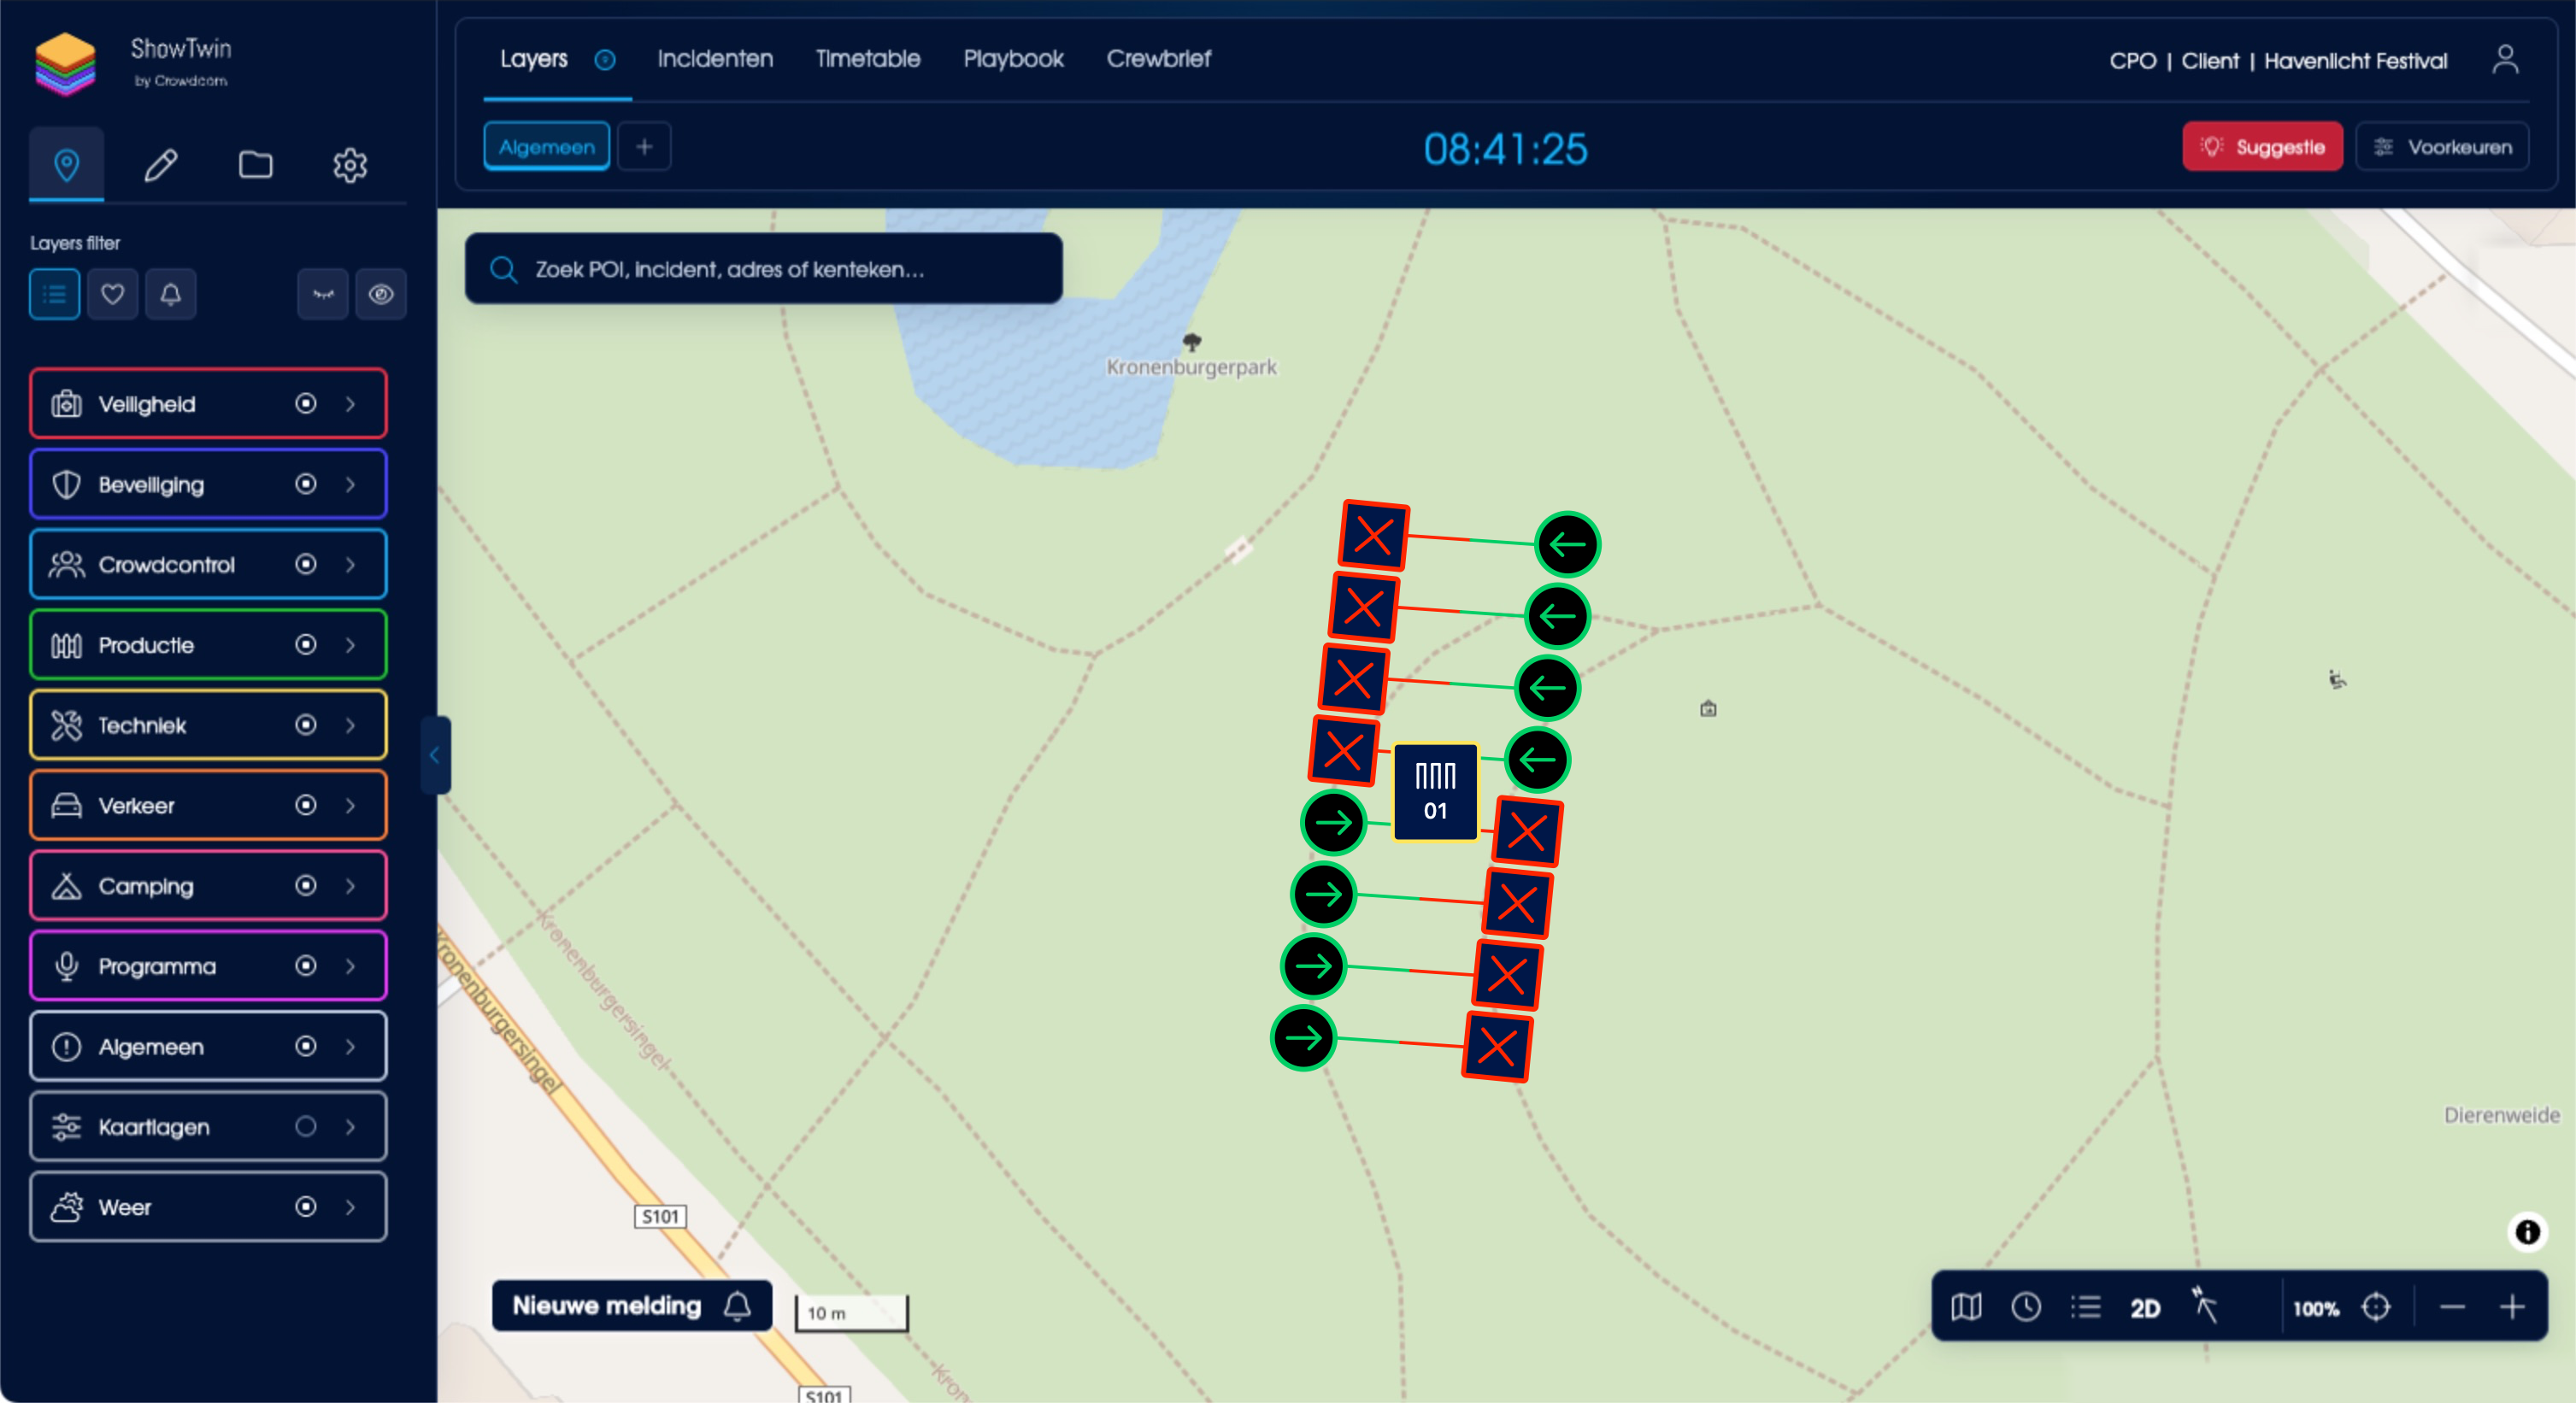
Control our partners’ products directly in ShowTwin, including LED tiles, gates and gatekeepers. Plan the settings for all access points in advance in a Playbook. Activate the Playbook at the touch of a button.
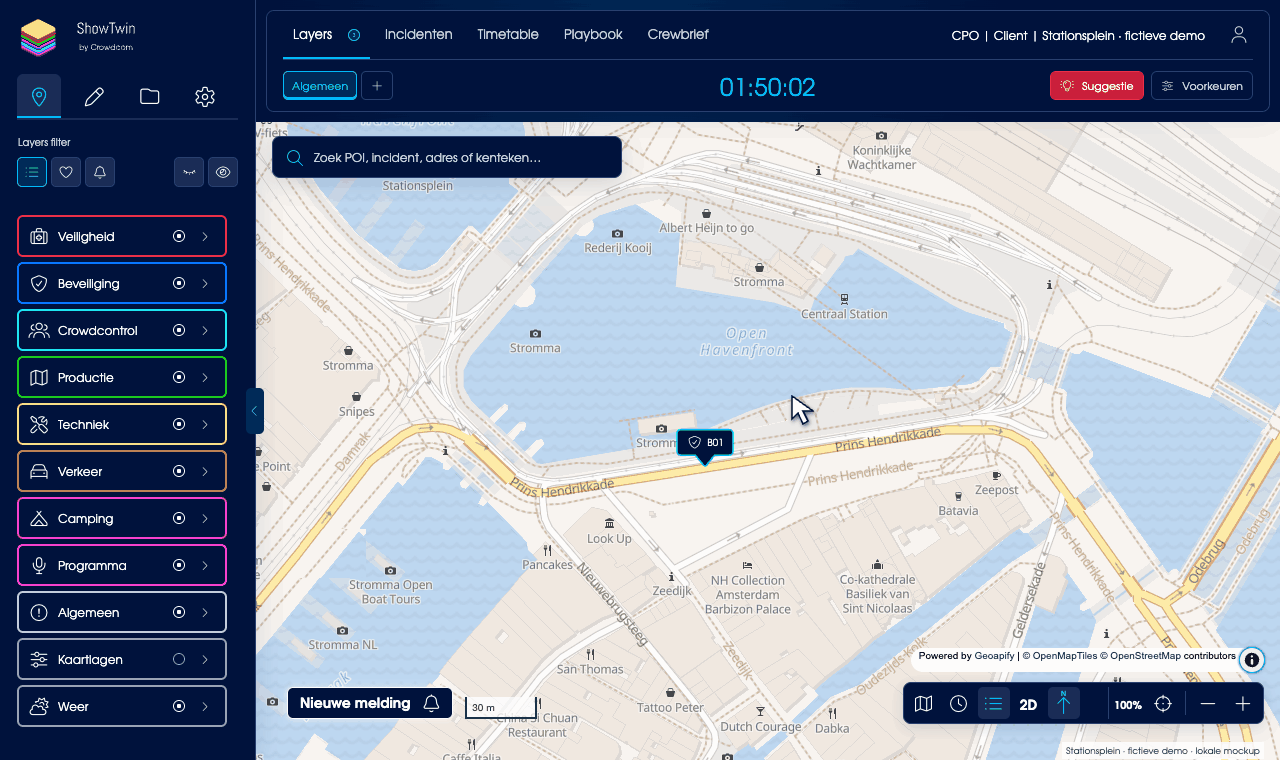
Record an incident and track the response in the same view. Share or delegate it to teams and colleagues. Managing incidents has never been easier.
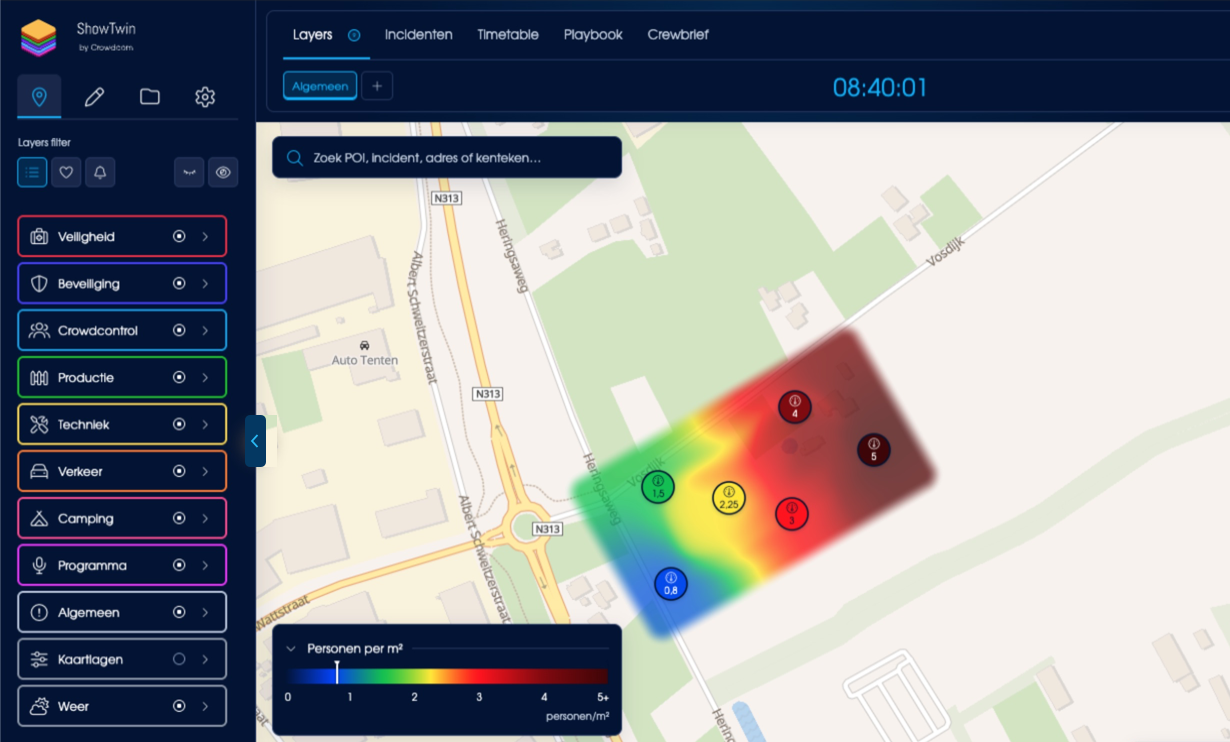
See how crowds are distributed and moving with readings from our sensors on site. Respond to trends and alerts. This is data visualisation, the ShowTwin way.
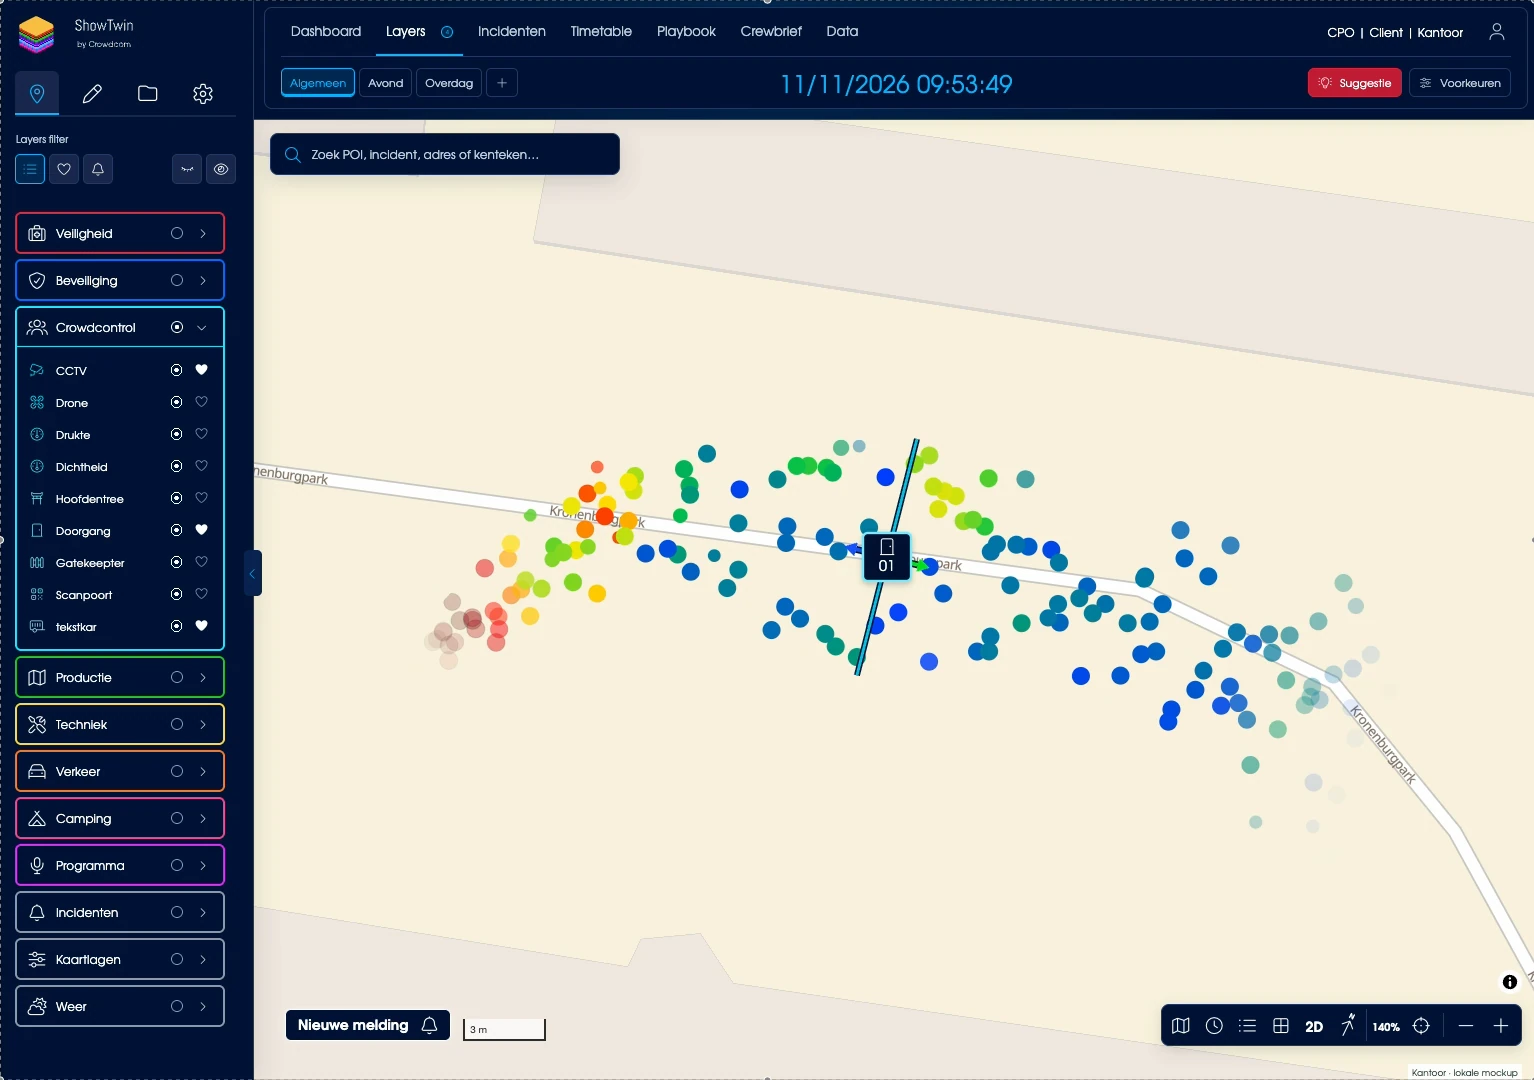
Track crowd flow and view readings from people counters as an animation, a chart or individual data points.
Everyone uses the same ShowTwin environment, with a view tailored to their work. Set your favourites, choose your map layers and see the information you need.
Let’s look at your projectChoose the layers that matter to your work, how markers appear and the context you want to see. ShowTwin remembers your preferences for your next project, even when you are working with a different client.
Satellite imagery or night mode. View traffic or track a thunderstorm. Your site plan, with or without a grid. Combine maps to help you work at your best.
ShowTwin is built for multidisciplinary teams. Work together on tasks and incidents, or delegate them to colleagues. If a report needs your attention, ShowTwin makes it clear what you have missed.
Find out whether ShowTwin is right for you.
Book an introductory meeting
ShowTwin is purpose-built as the central hub of the Event Control Center. It brings organisers together with safety professionals, control room operators, security, emergency services and other disciplines. In the ECC, a comprehensive operational picture is vital for fast decisions and clear choices. ShowTwin supports this approach with a powerful engine that turns thousands of information points into one clear picture. That is why we call ShowTwin the digital twin of the show.
You can set up ShowTwin yourself, upload maps and place markers. We help with more complex setups, such as GPS and sensor integrations. During the event, your team can use ShowTwin on a Cdesk or their own laptops. We also provide a local server to safeguard all data during internet outages.
ShowTwin is built for everyone who takes event safety as seriously as we do. That is why we have kept pricing as simple as possible. Preparing projects is always free. During the event, we charge a single fee per user per week. Additional charges apply to some modules.
ShowTwin brings operational information together in the context of your project, including map data, weather and traffic. Available sources also include GPS tracking, drone detection, our range of people counters and density sensors, and weather readings such as those from WBGT Control’s WBGT sensor. Is there a source you would like to see on the map? Get in touch!
Simply request a demo below. Leave your company name and email address, and we will be in touch soon. During our introductory meeting, we will discuss your event and answer your questions. We will set up a demo environment for you to explore. Already have access? Go to the login page.
Ready for a digital twin of your event? Let’s talk. Leave your organisation name and email address, and we will discuss how ShowTwin can support your planning and event delivery.
See the workspace in action
Focus on your team and ways of working
Time for your questions
We will get in touch to discuss what you need.
From the interactive Layers map to the plans behind the scenes. Open a section to see how ShowTwin brings information together.
Bring locations, sensor data, GPS positions and operational information together. Add traffic, public transport and other available sources to the interactive map, including the Dutch P2000 emergency paging feed.
See it in a demoSelect a location on the map and choose the relevant category straight away. Manage the incident with colleagues or delegate the task.
See it in a demo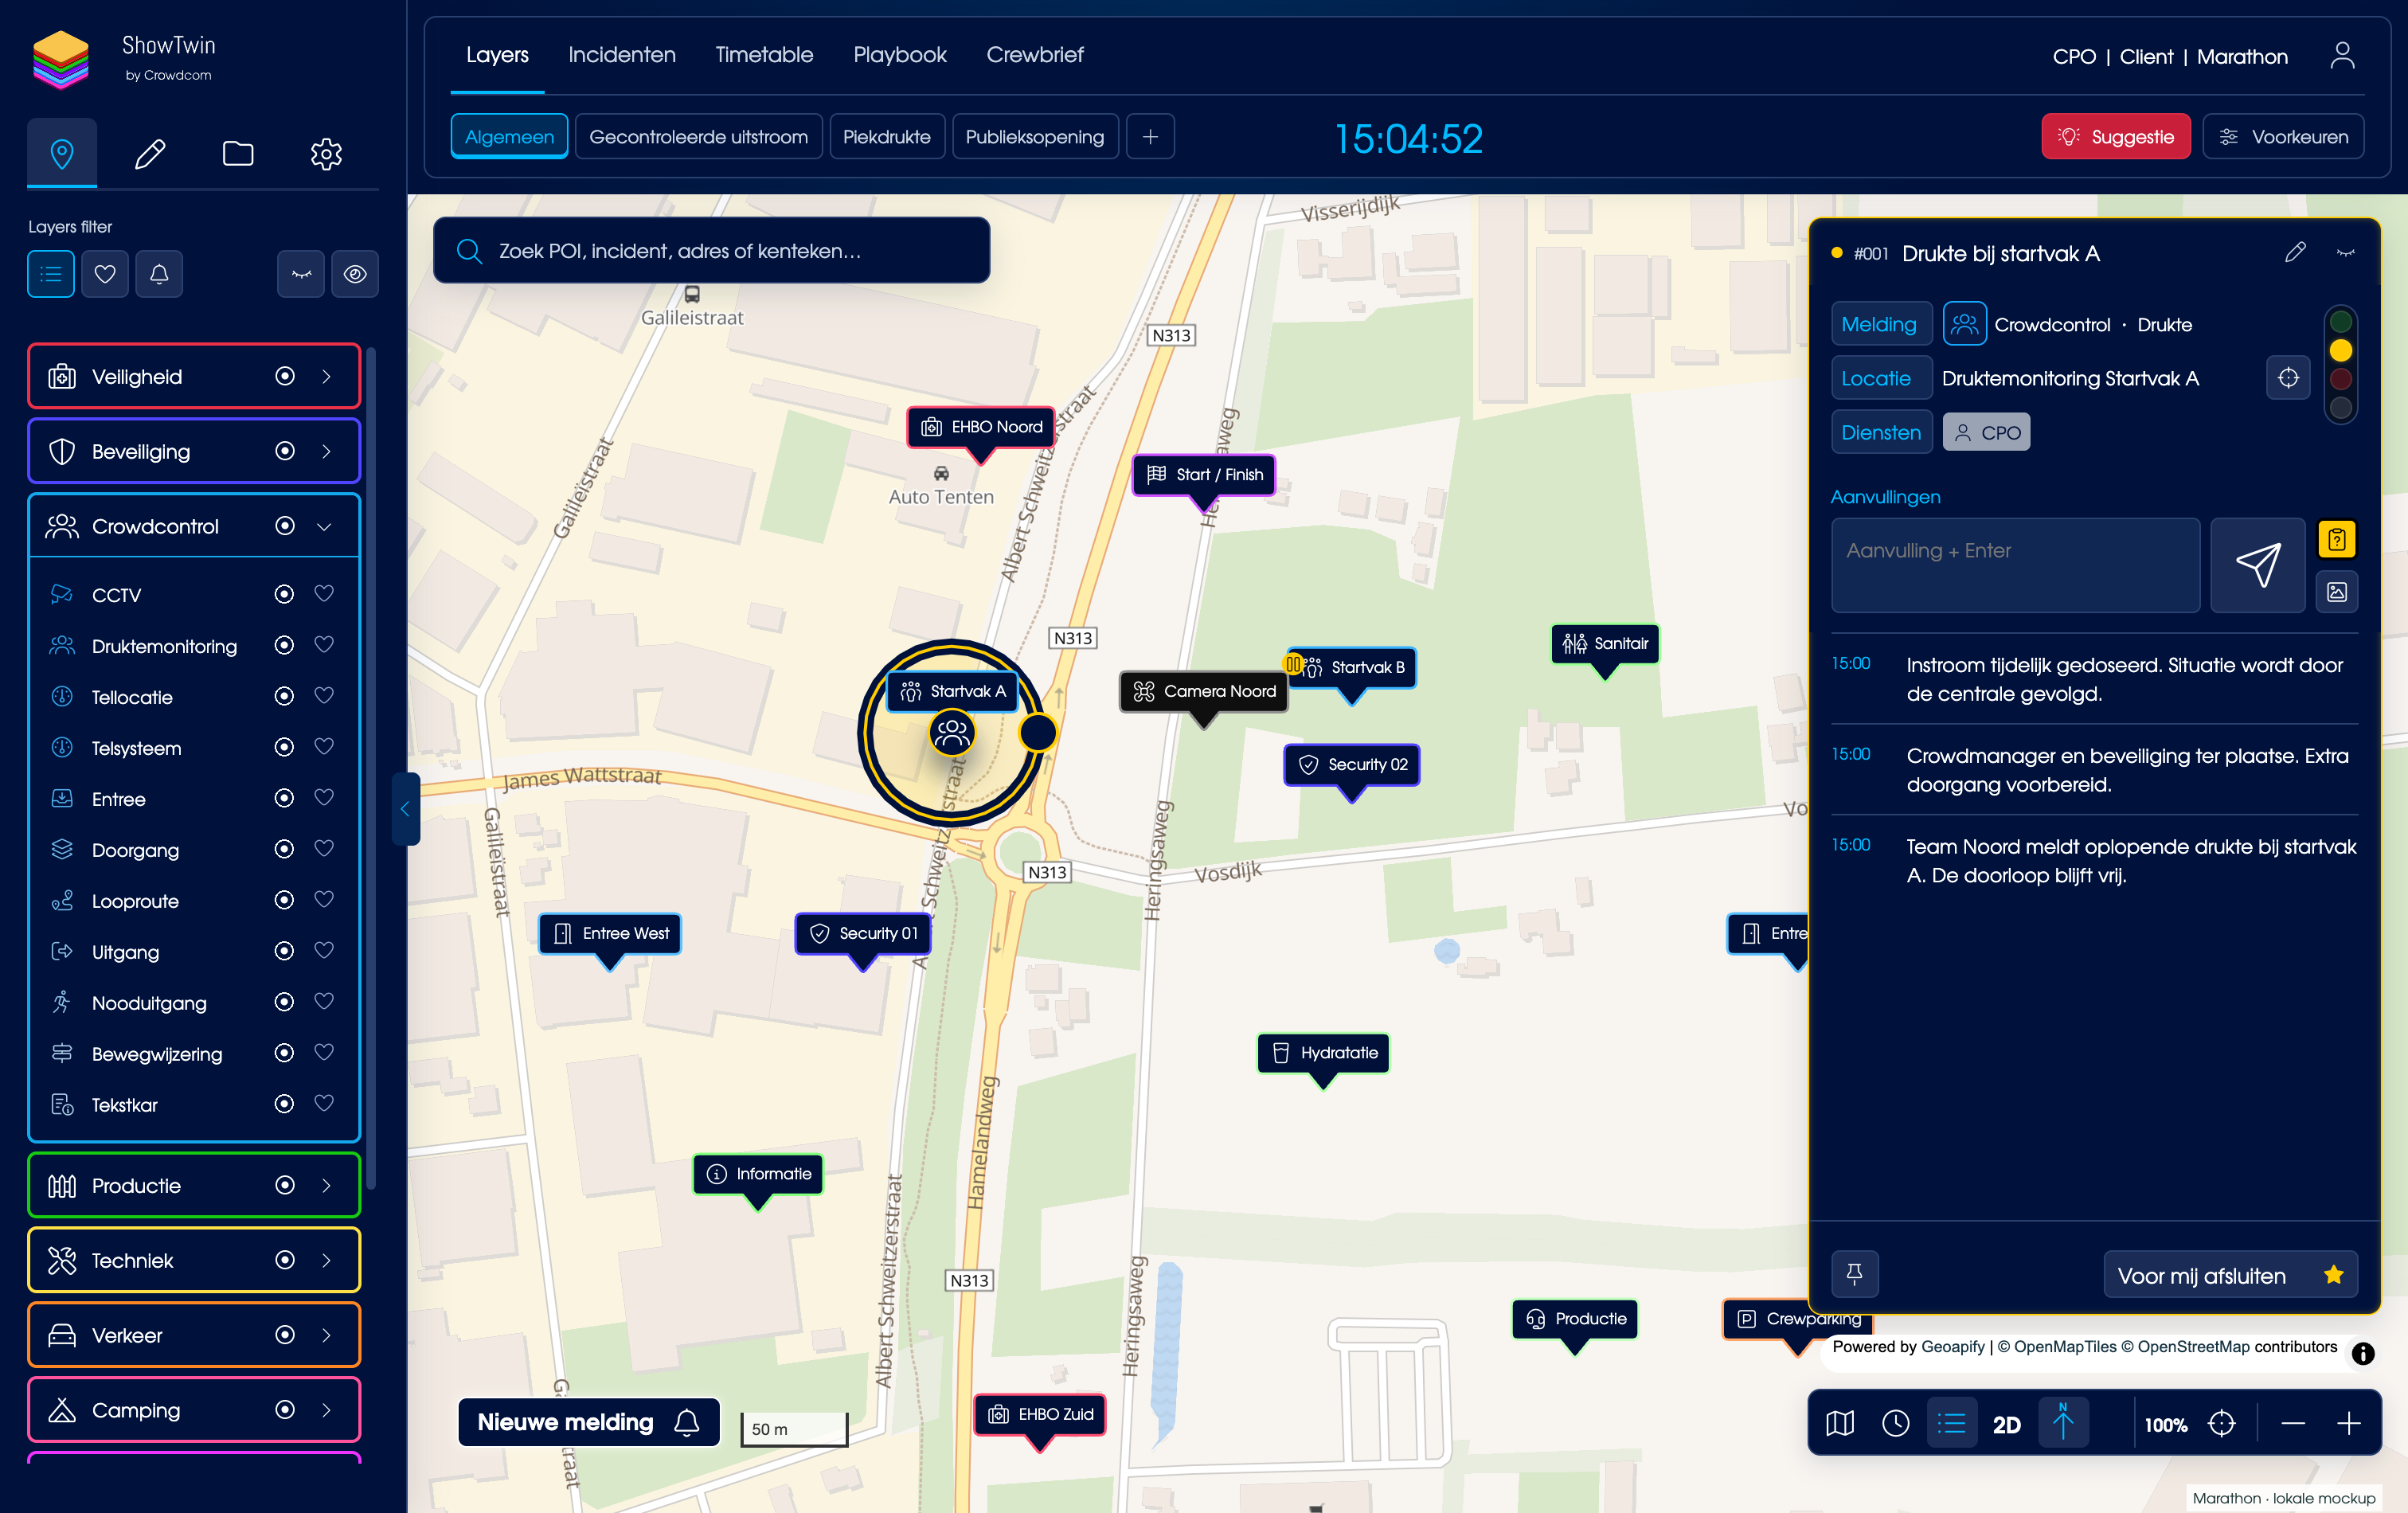
Plan activities and checks, assign tasks and track progress. Choose a list, spreadsheet or timeline to suit the way your control room works.
See it in a demo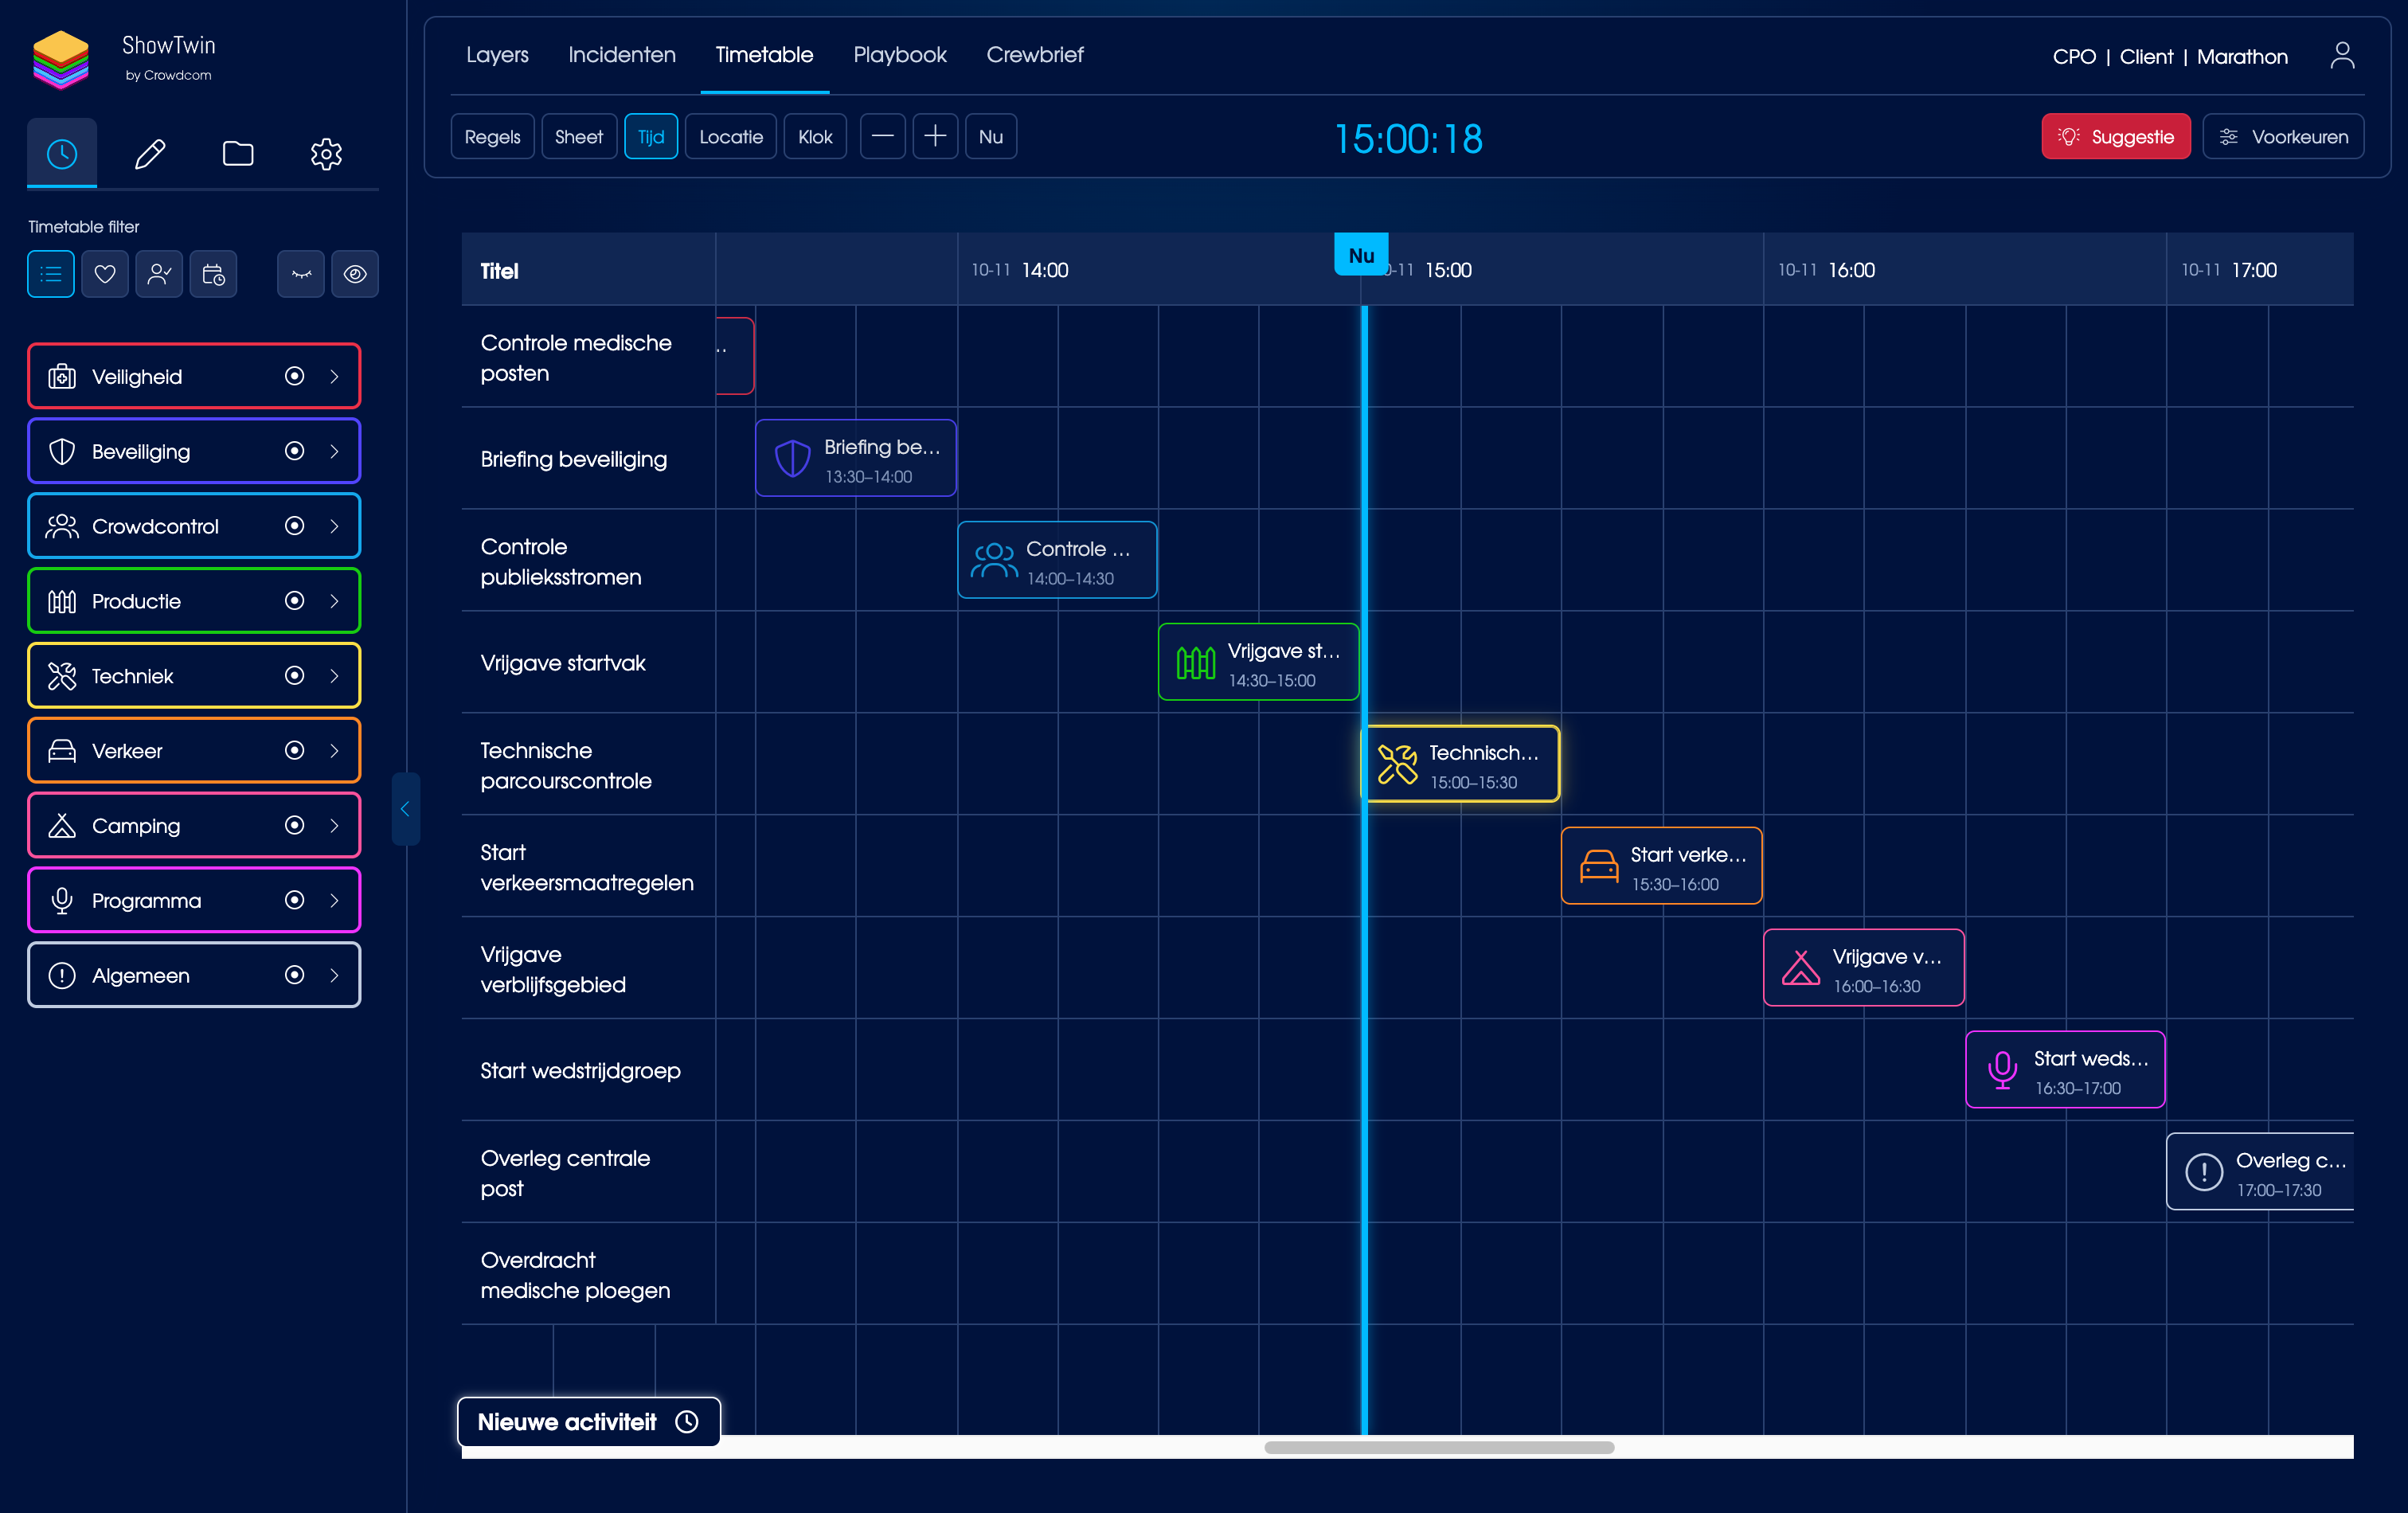
A Playbook captures how you want your site to be set up at a particular moment. Prepare the map with the positions, routes and access point settings for each scenario, from daytime and night-time operations to ingress, egress and emergencies.
See it in a demo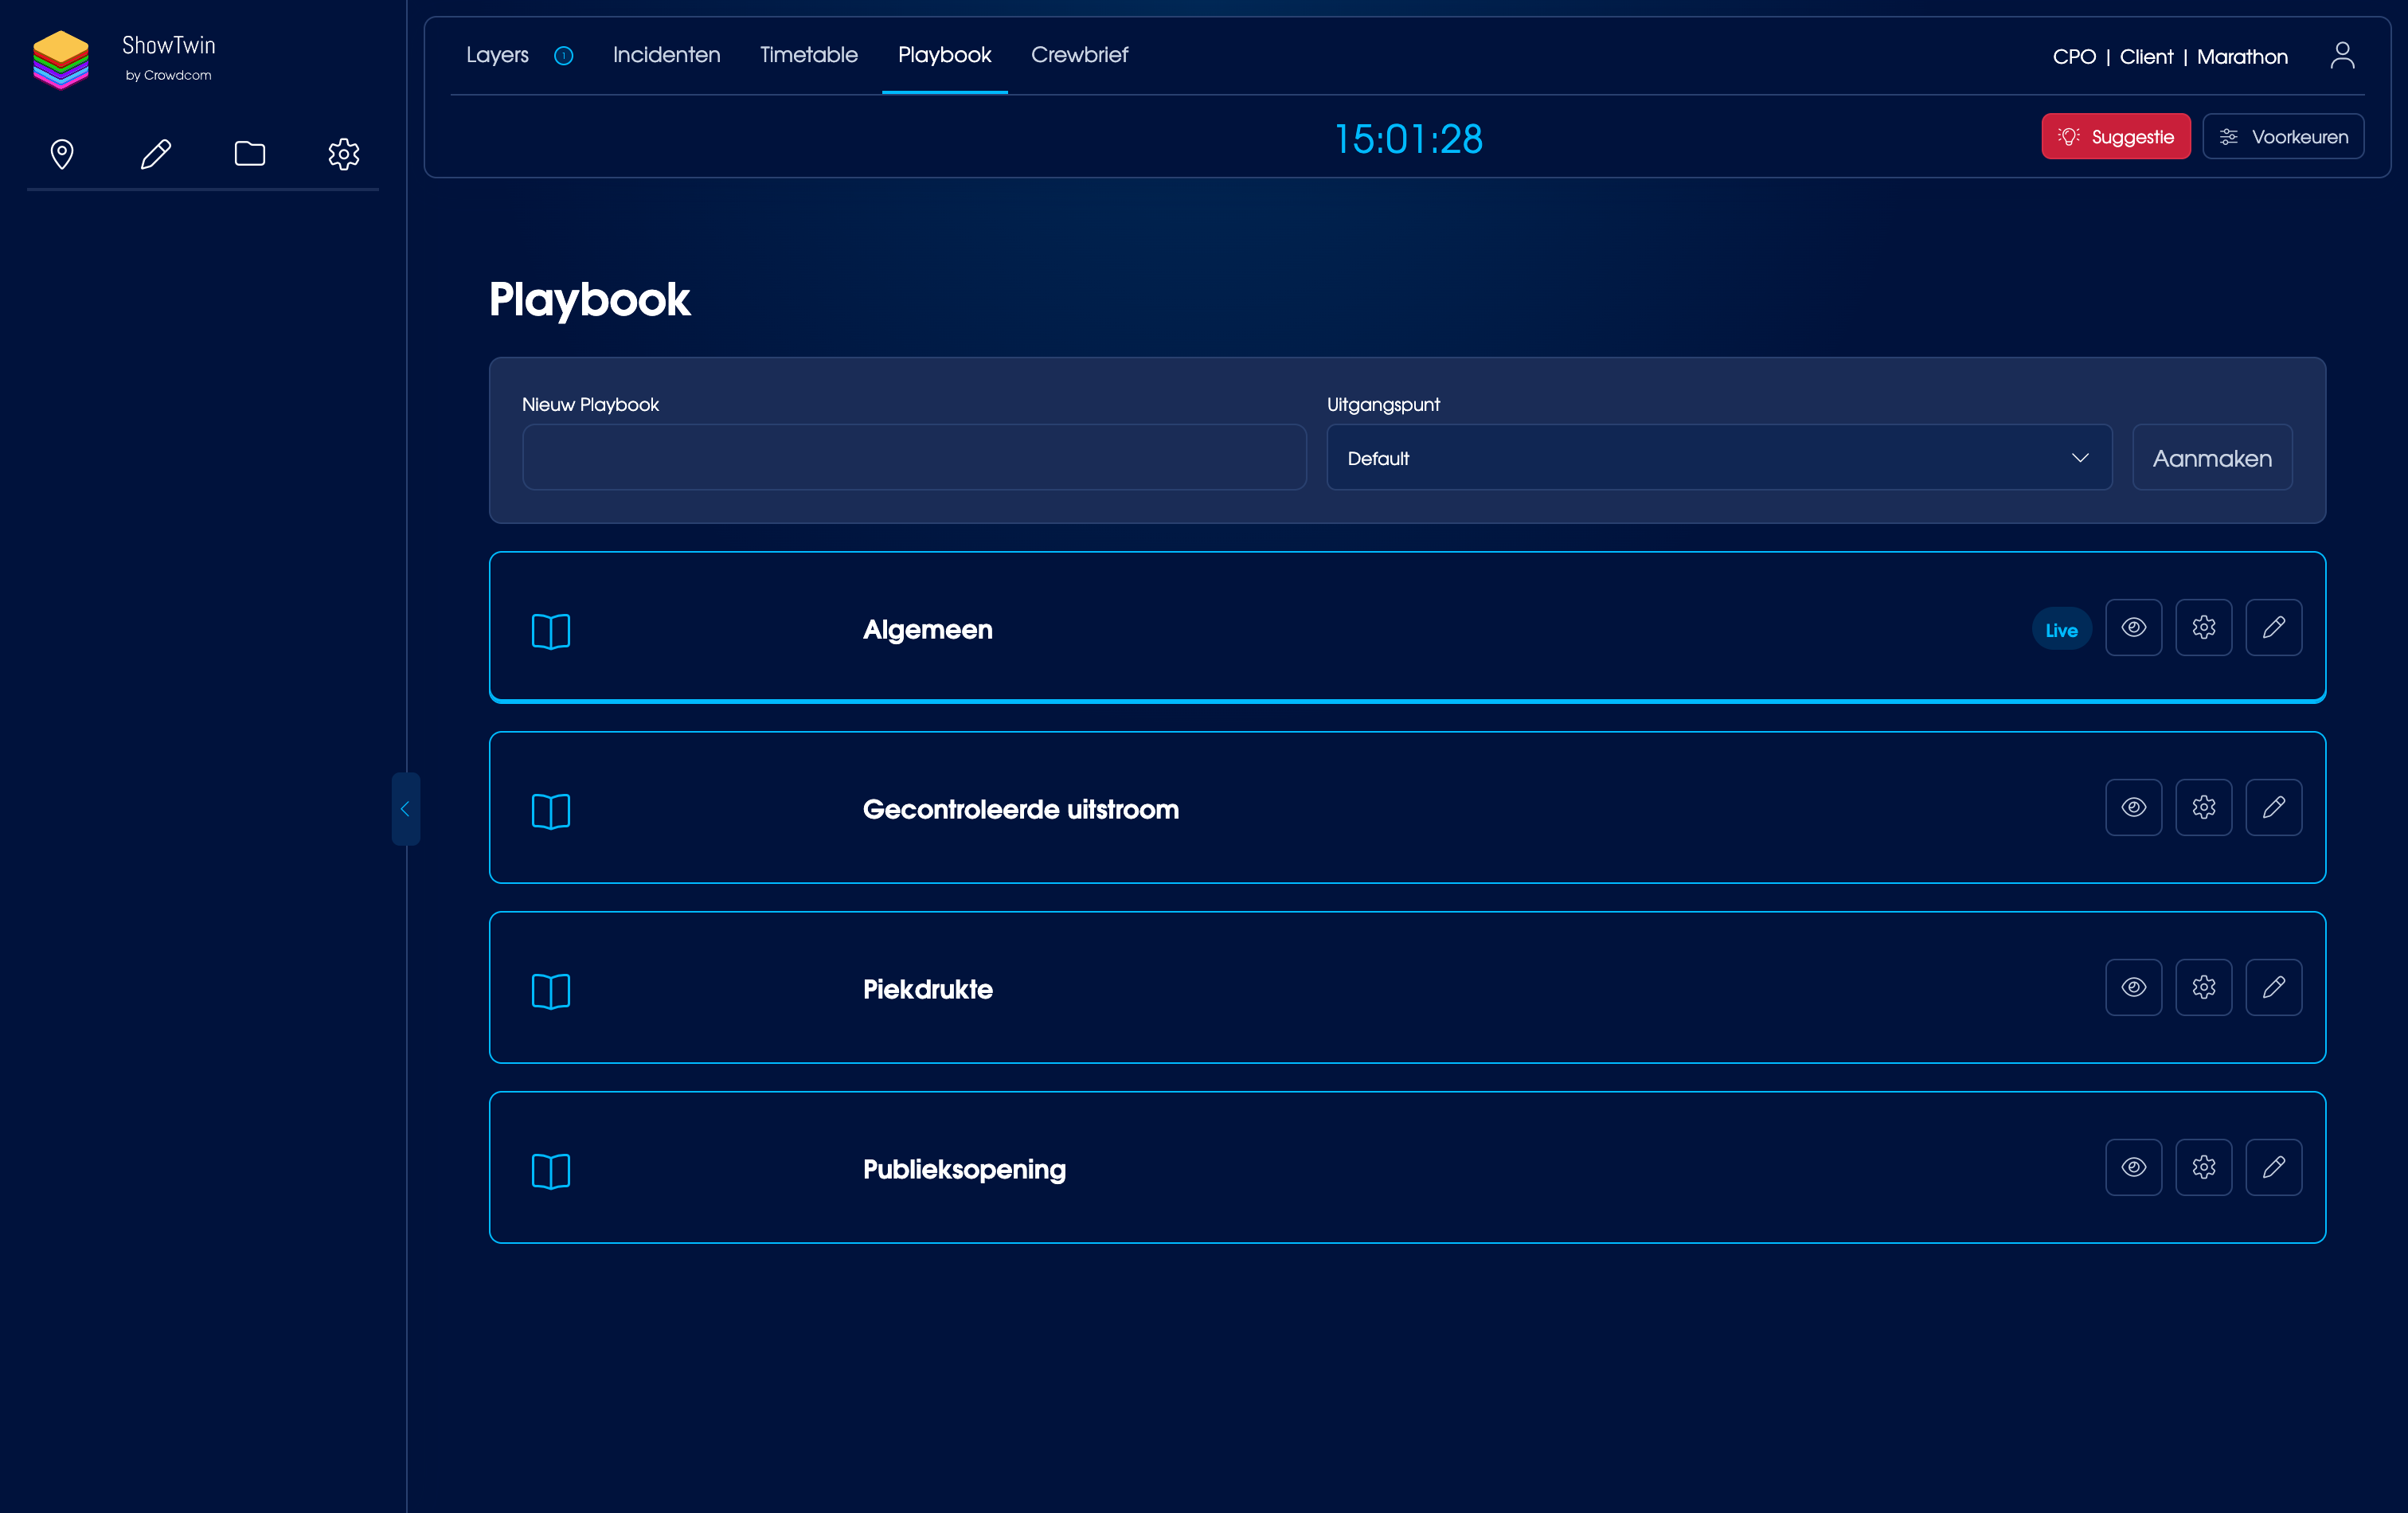
Create briefings for fixed posts and teams using your project information. Bring maps, locations and instructions together, and share what each team needs.
See it in a demo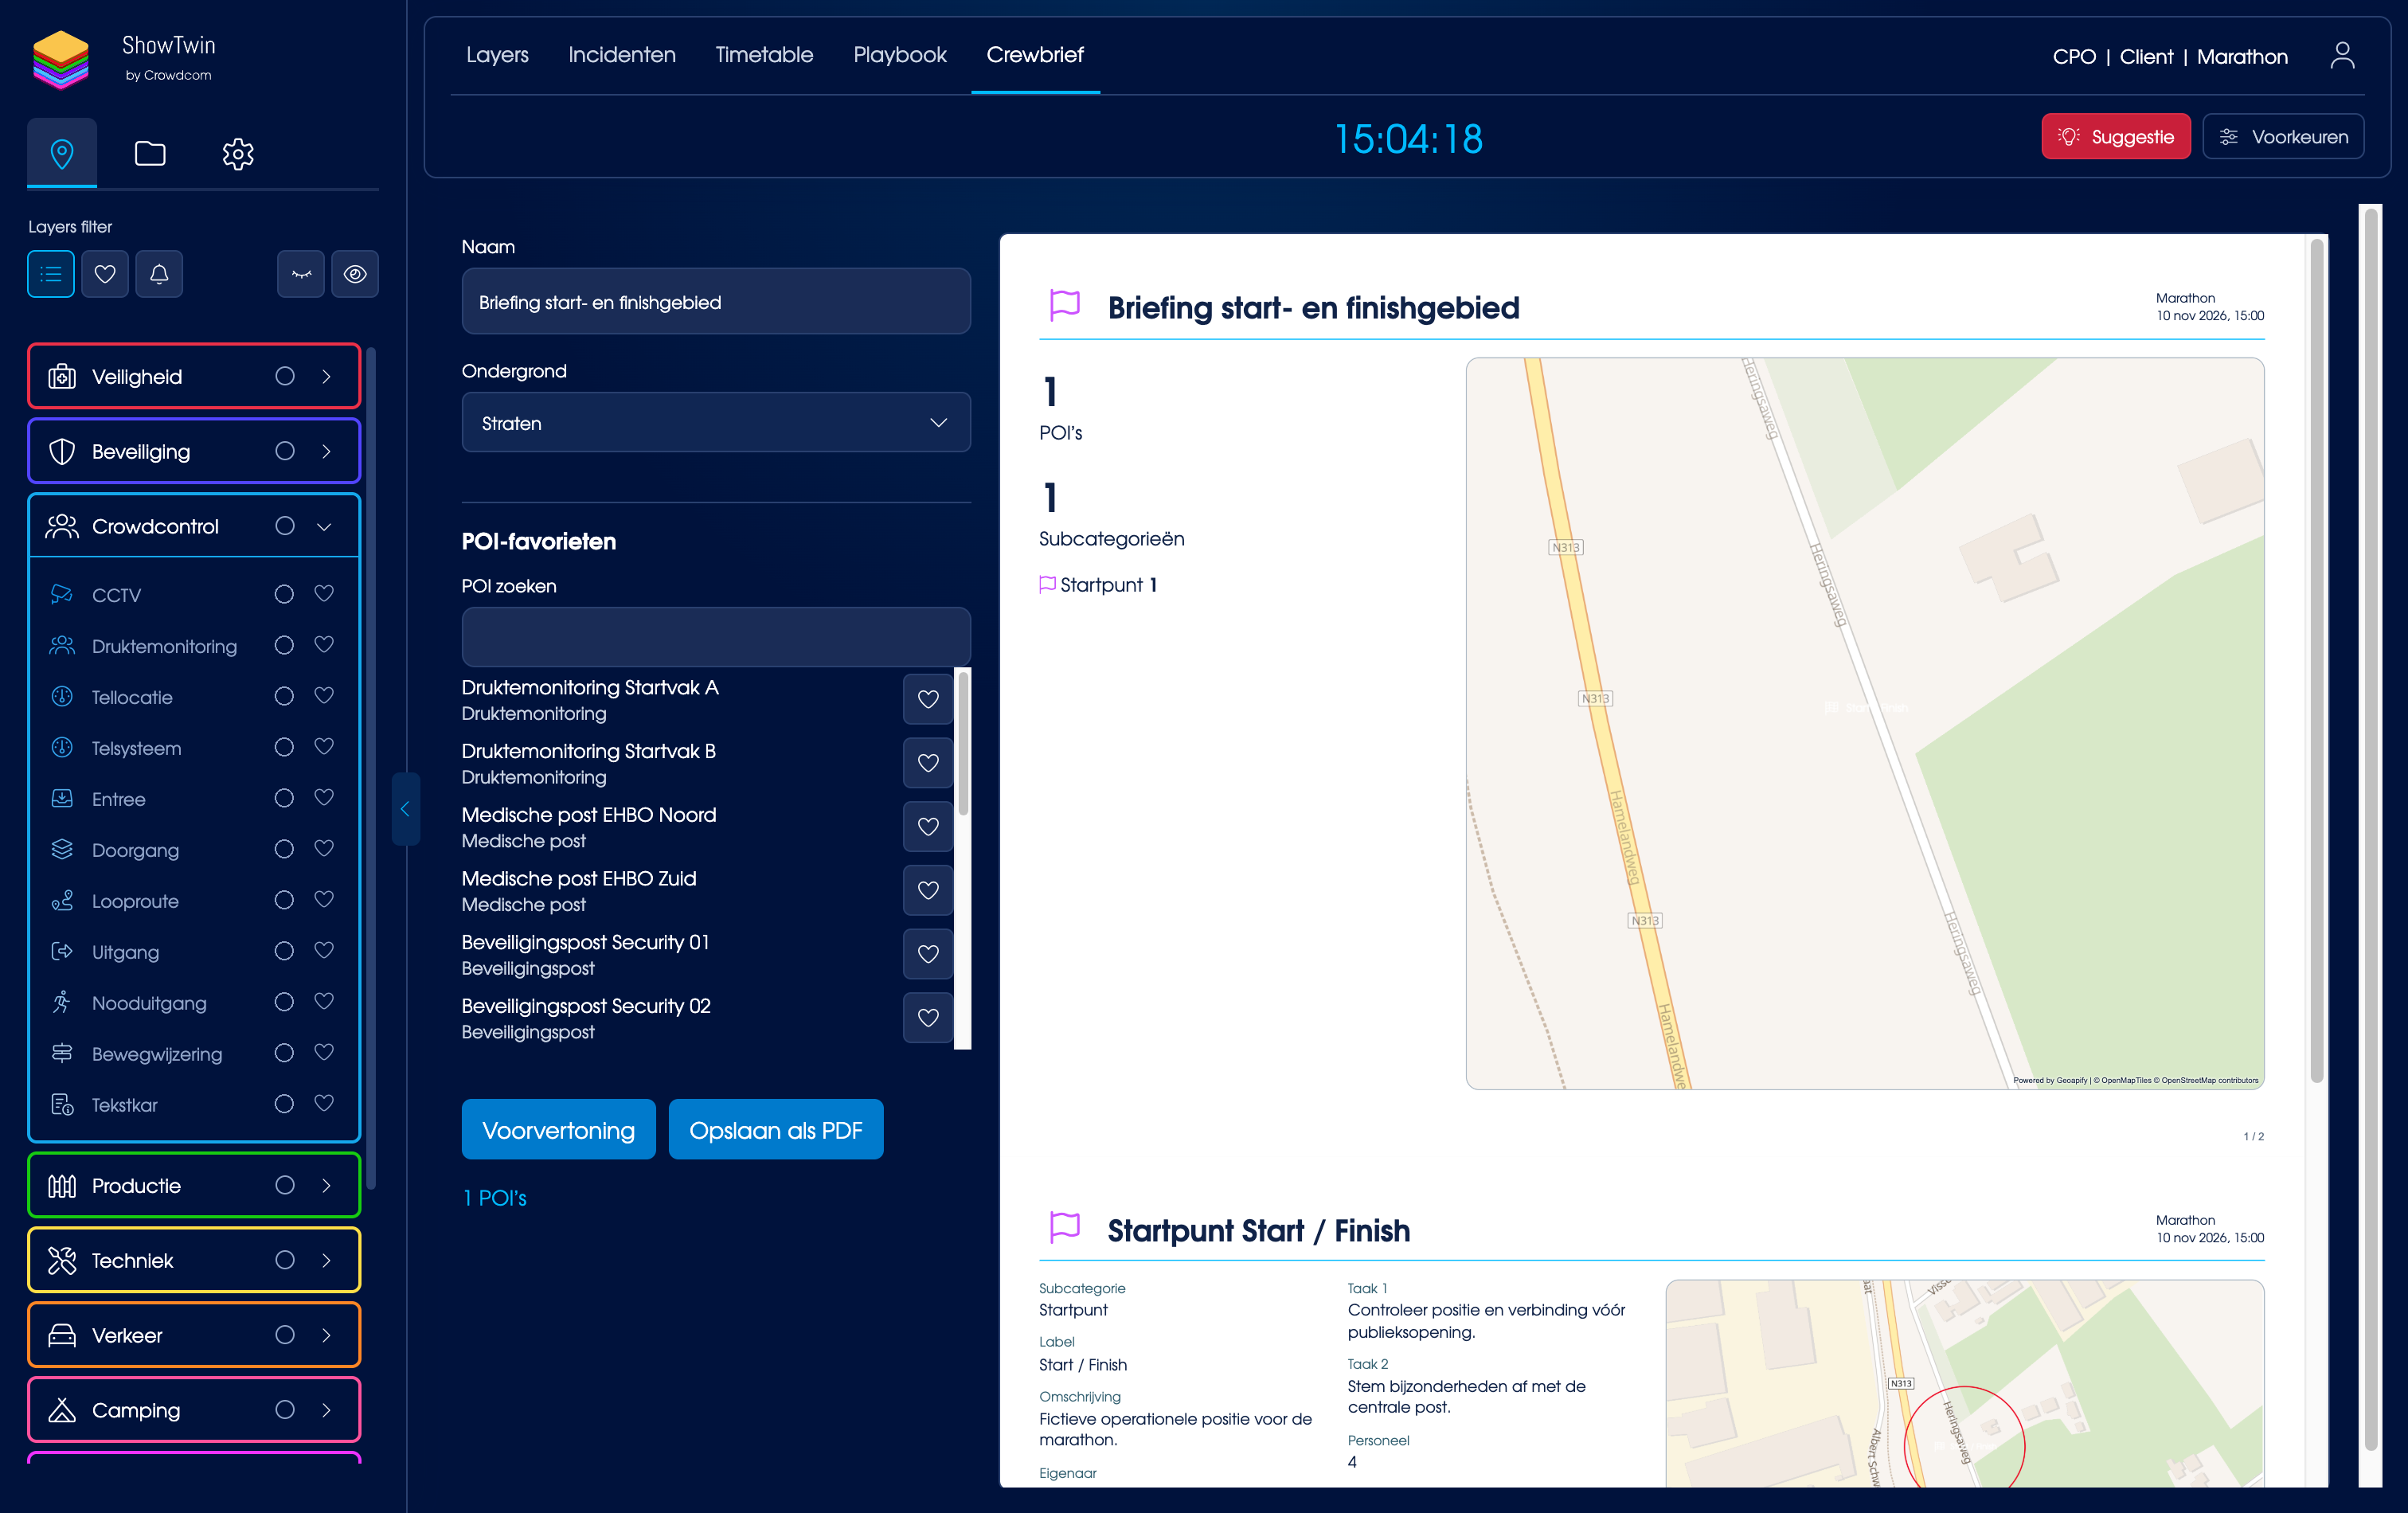
Invite people, choose their project roles and manage who can see and do what. Reuse your address book on your next project without entering existing contacts again.
See it in a demo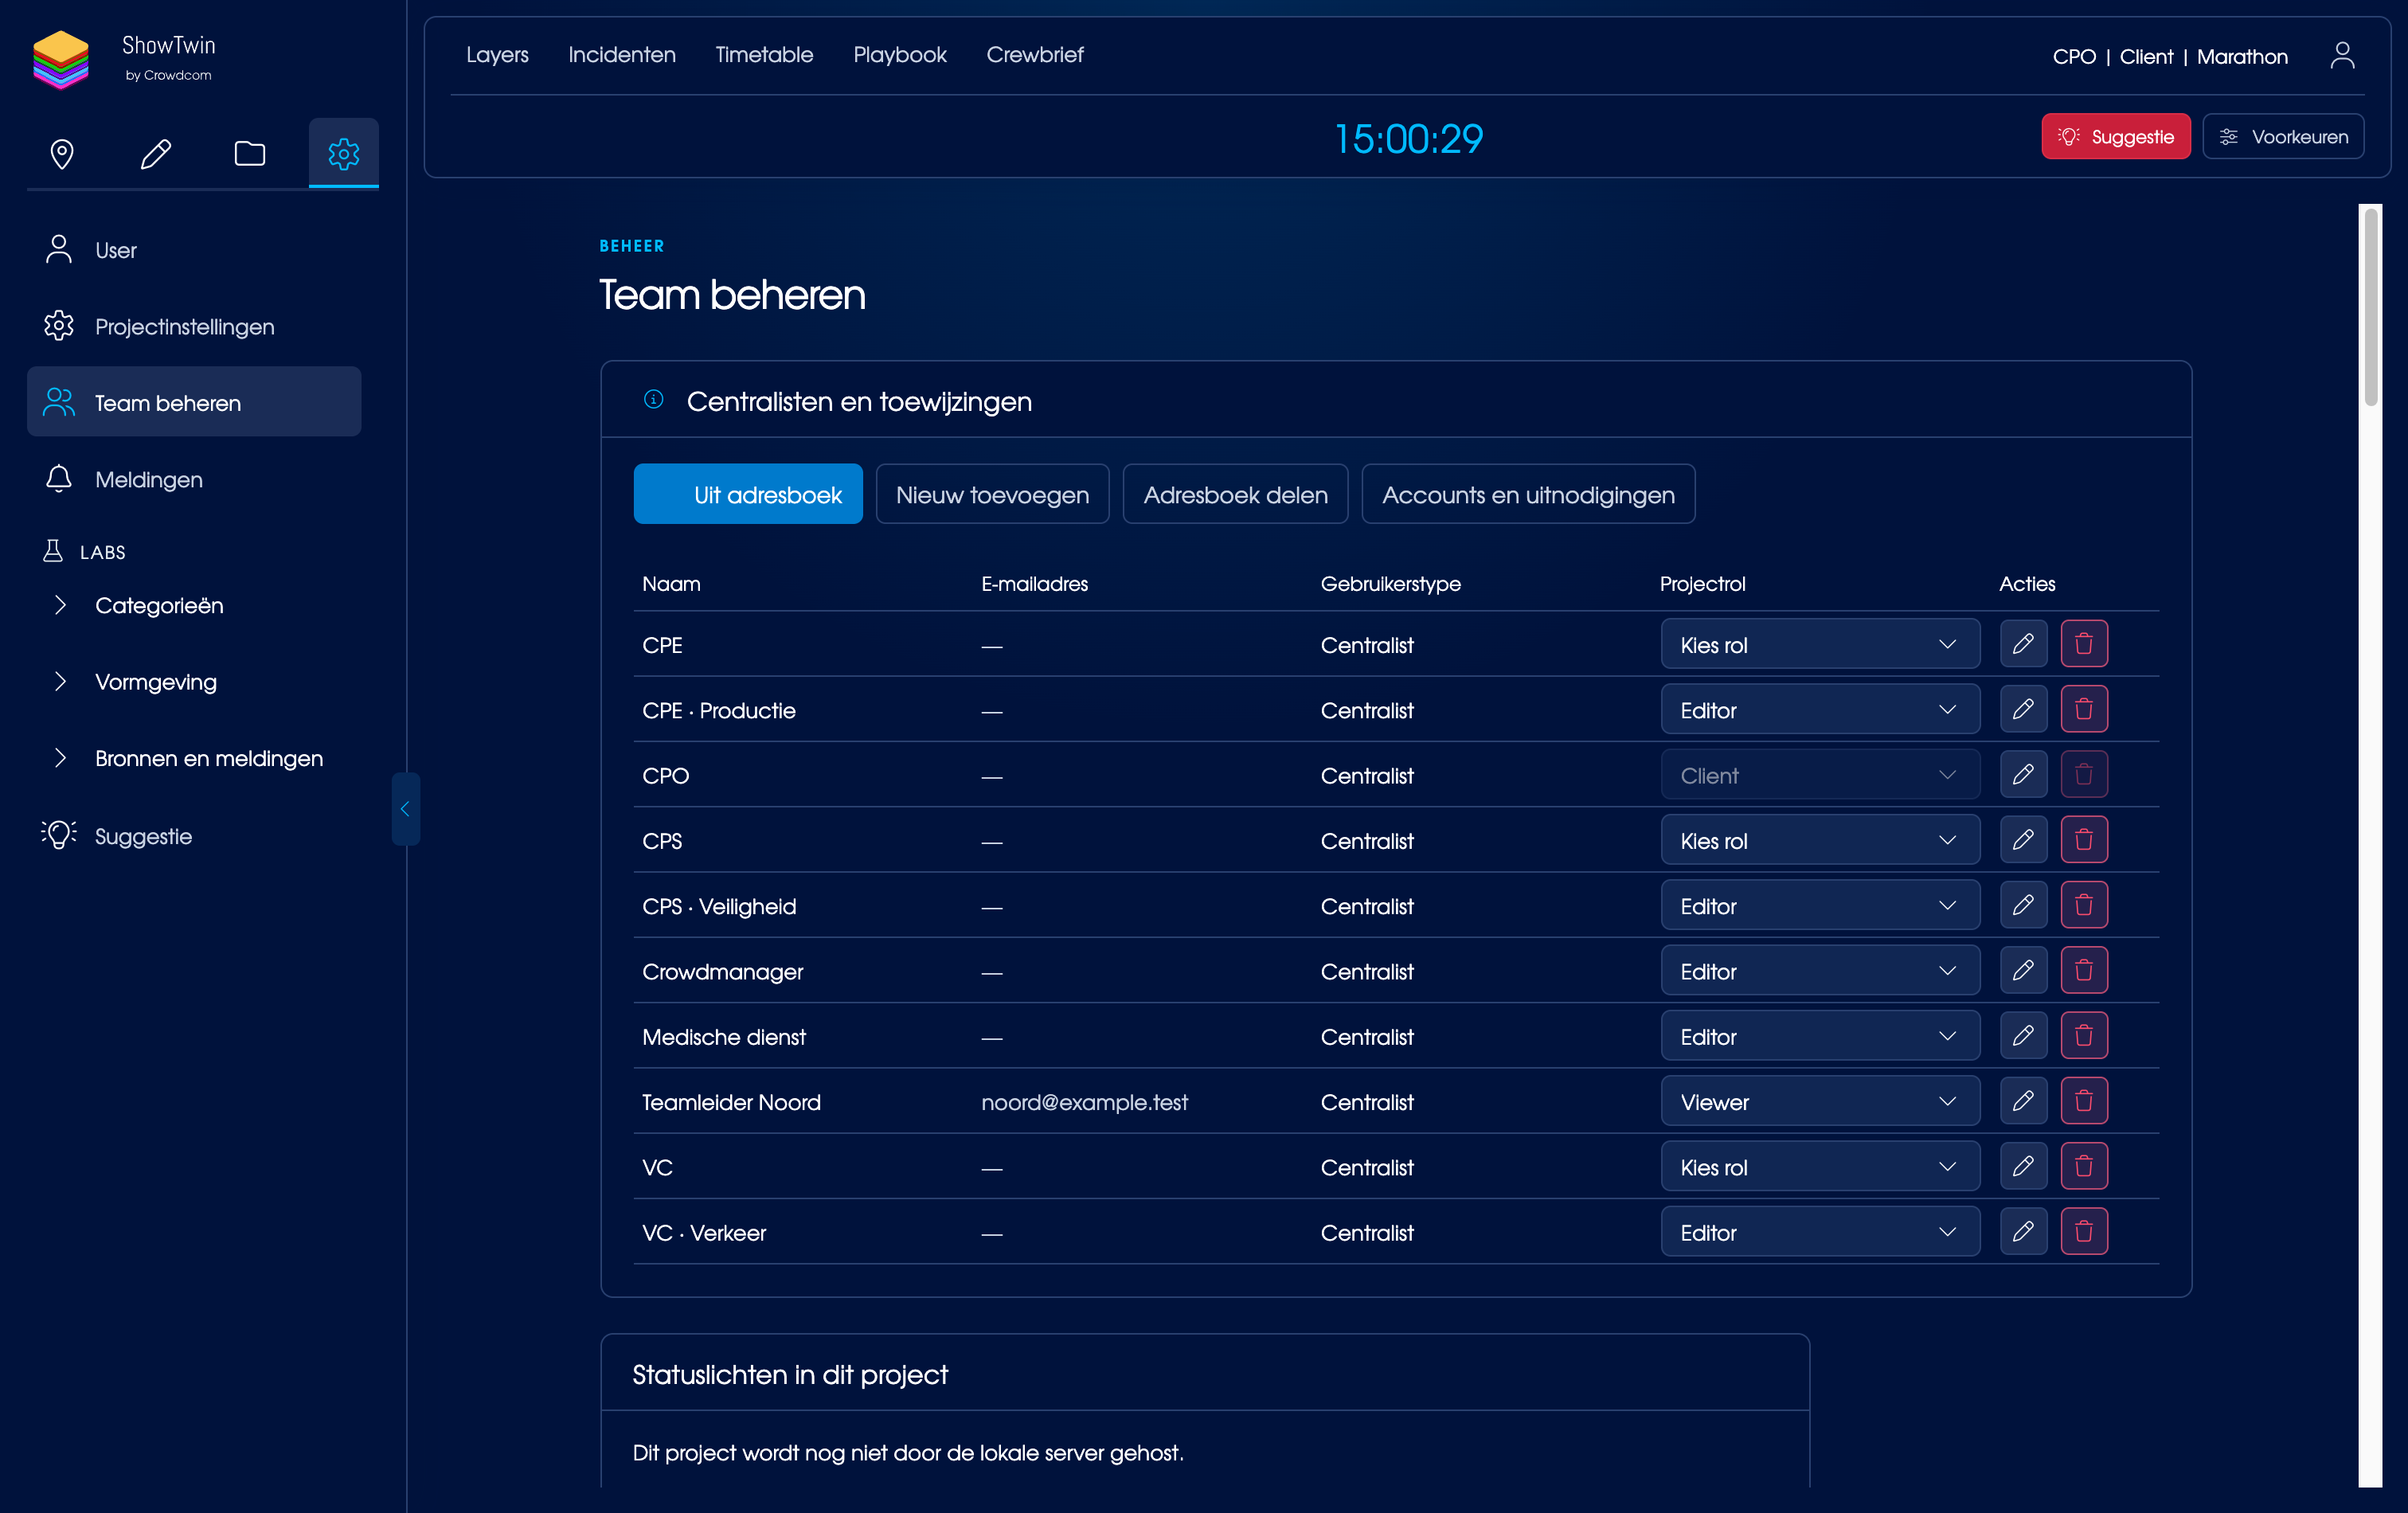
Live CCTV and drone feeds in Layers. Control connected cameras and have supported cameras automatically point towards incidents.
See it in a demoRainfall, temperature and lightning on your map. Combine available weather sources with your own sensors and WBGT measurements for an overview of conditions on site.
See it in a demo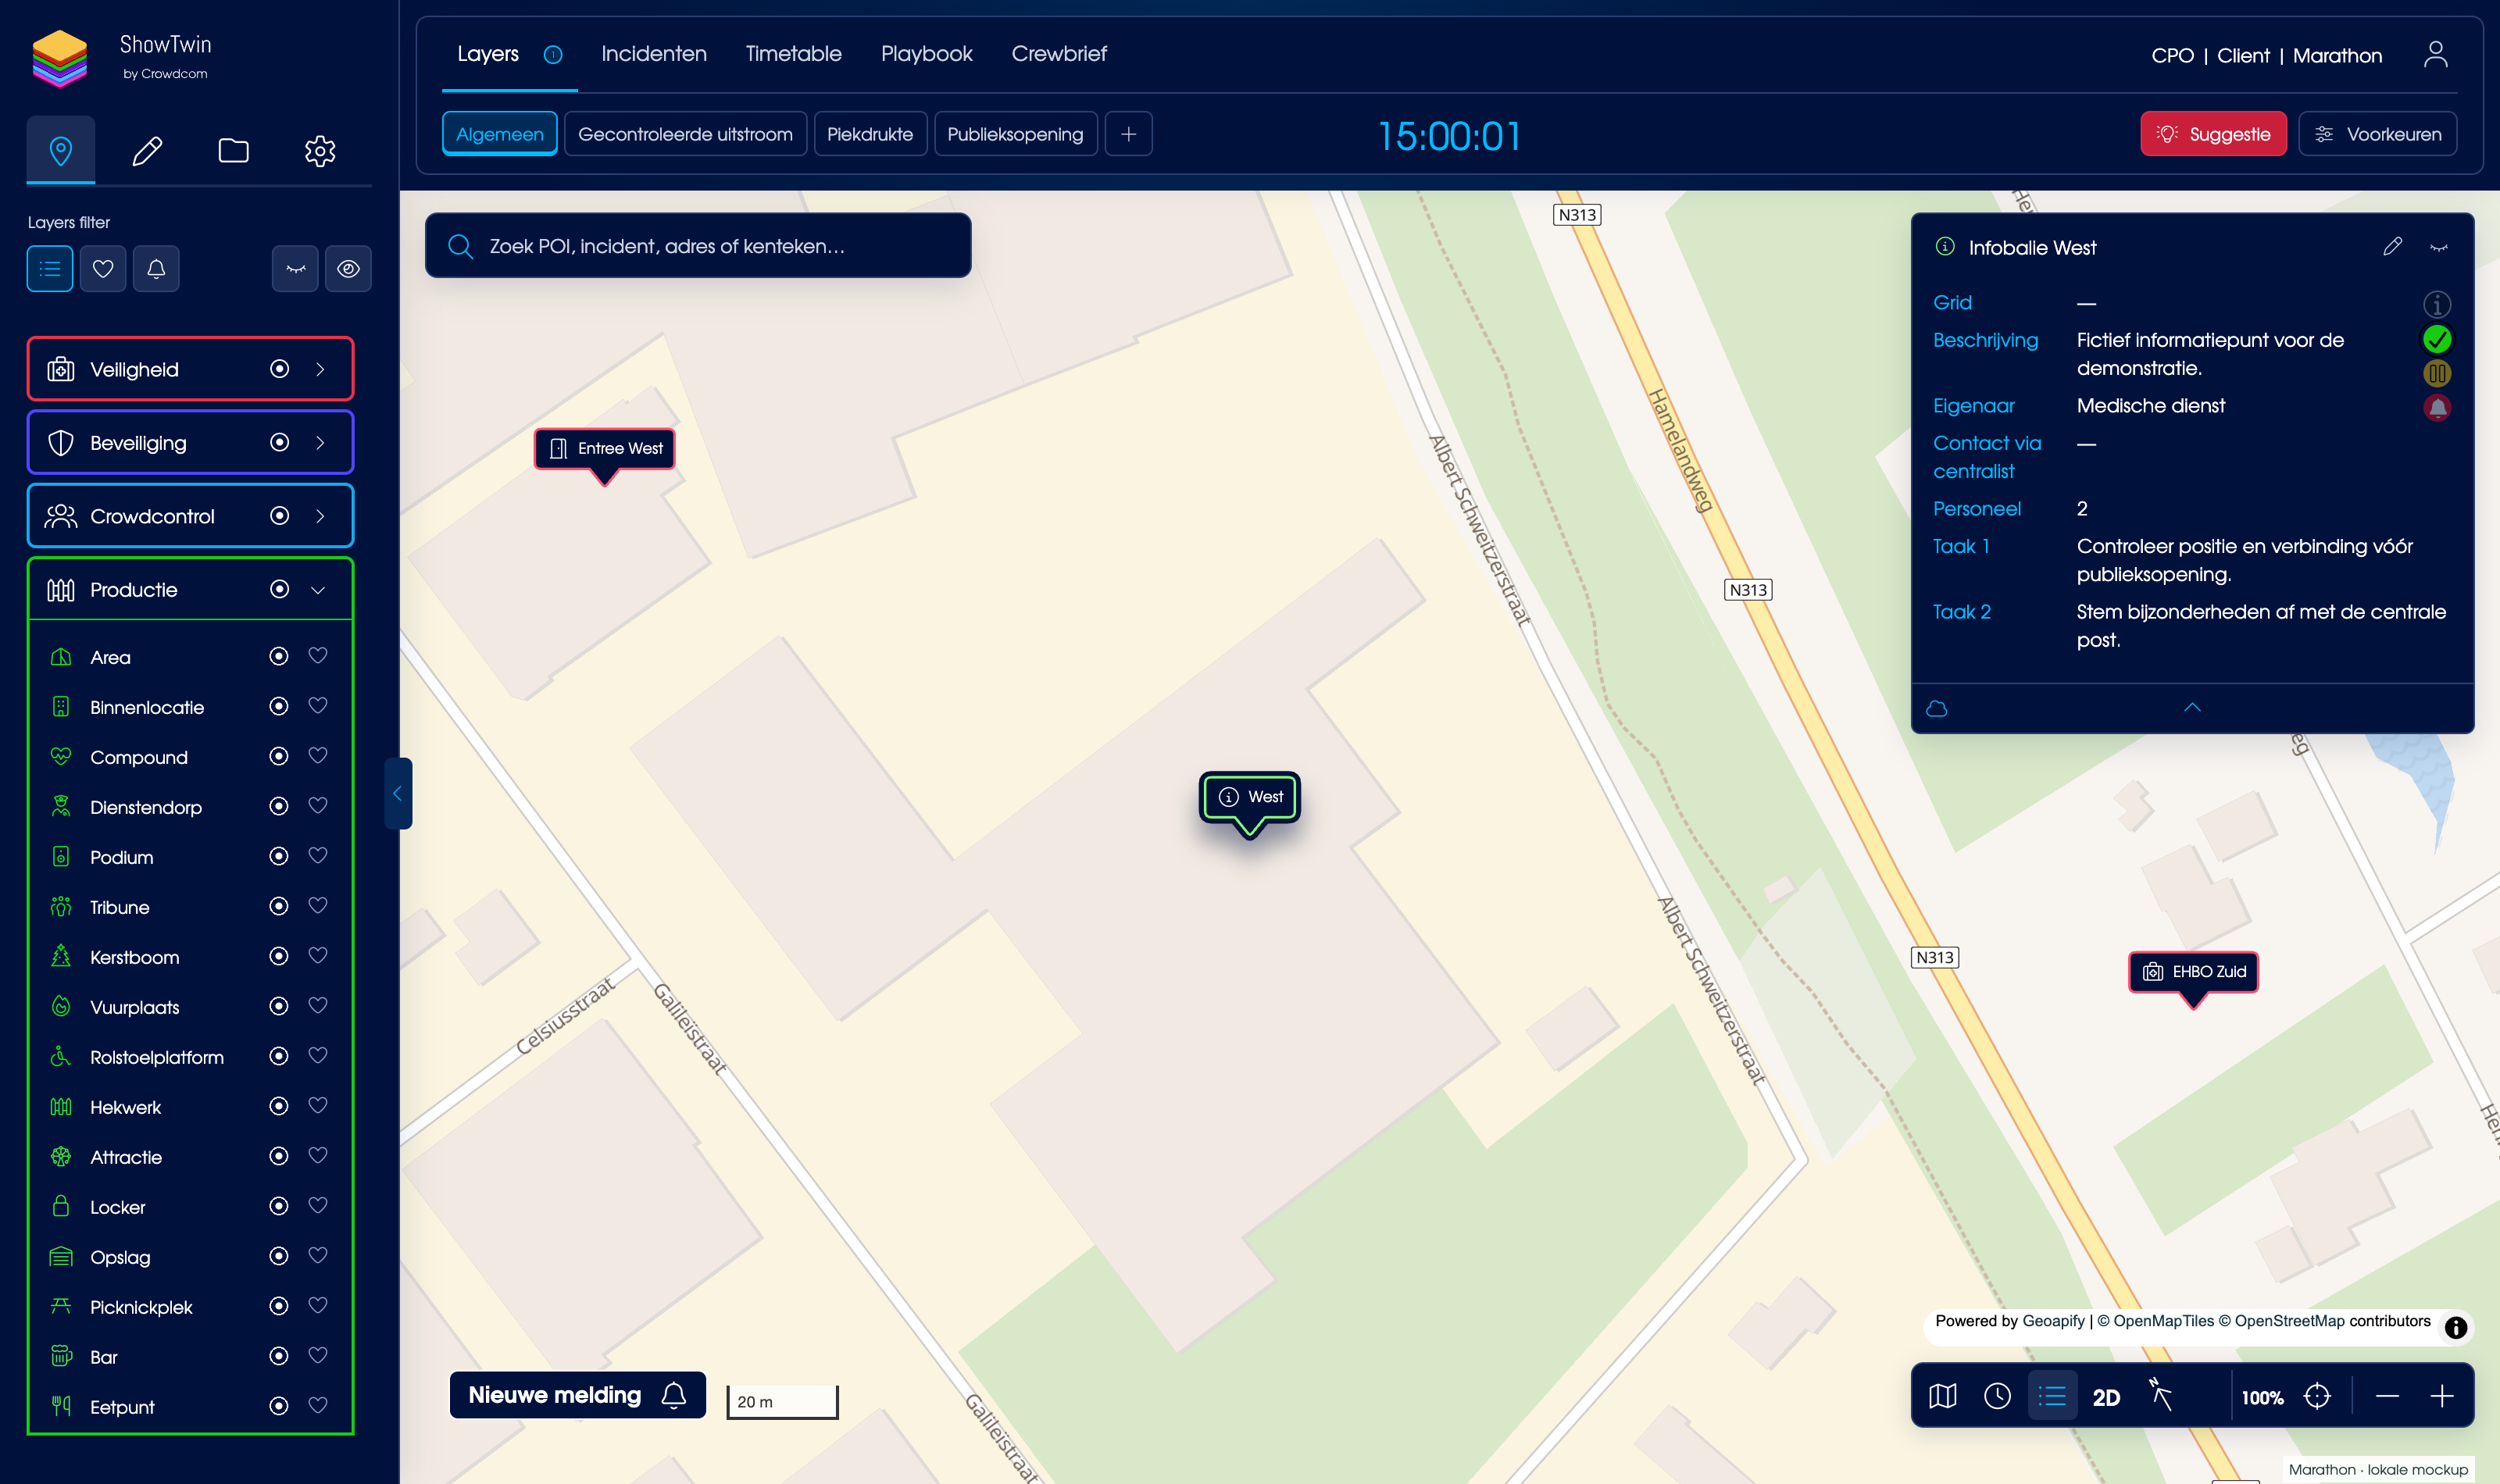
Explore environments in 3D and add context such as public transport flows, flight data and traffic congestion. View your site, transport and operational positions in the context you need.
See it in a demoControl gatekeepers and gates directly from Layers. Operate LED tiles through connected systems and monitor movement through access points in both directions.
See it in a demo








Want to become a partner too? Join us today!
Can’t see your partner here? Send them an invitation